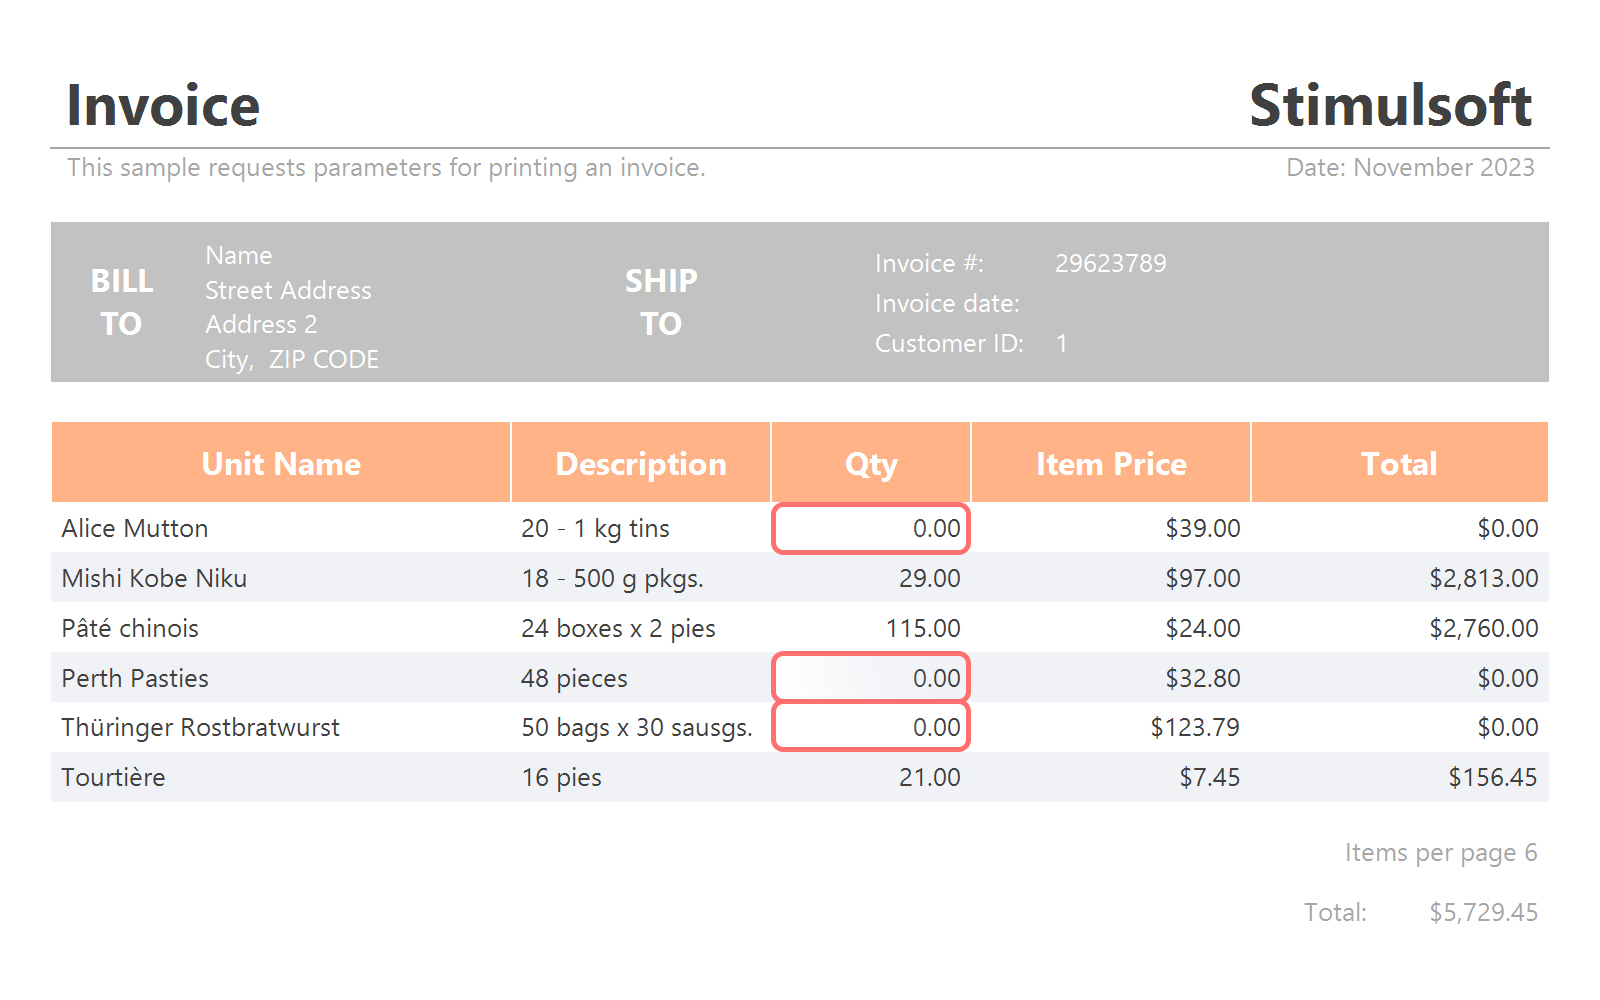
In today's article, we will discuss how to avoid blank lines in a report. We won't just cover disabling components when there is no data; we will also explore eliminating empty lines that may appear when components are disabled. But before we dive into that, let's examine a sample of zero data for the Data Band.
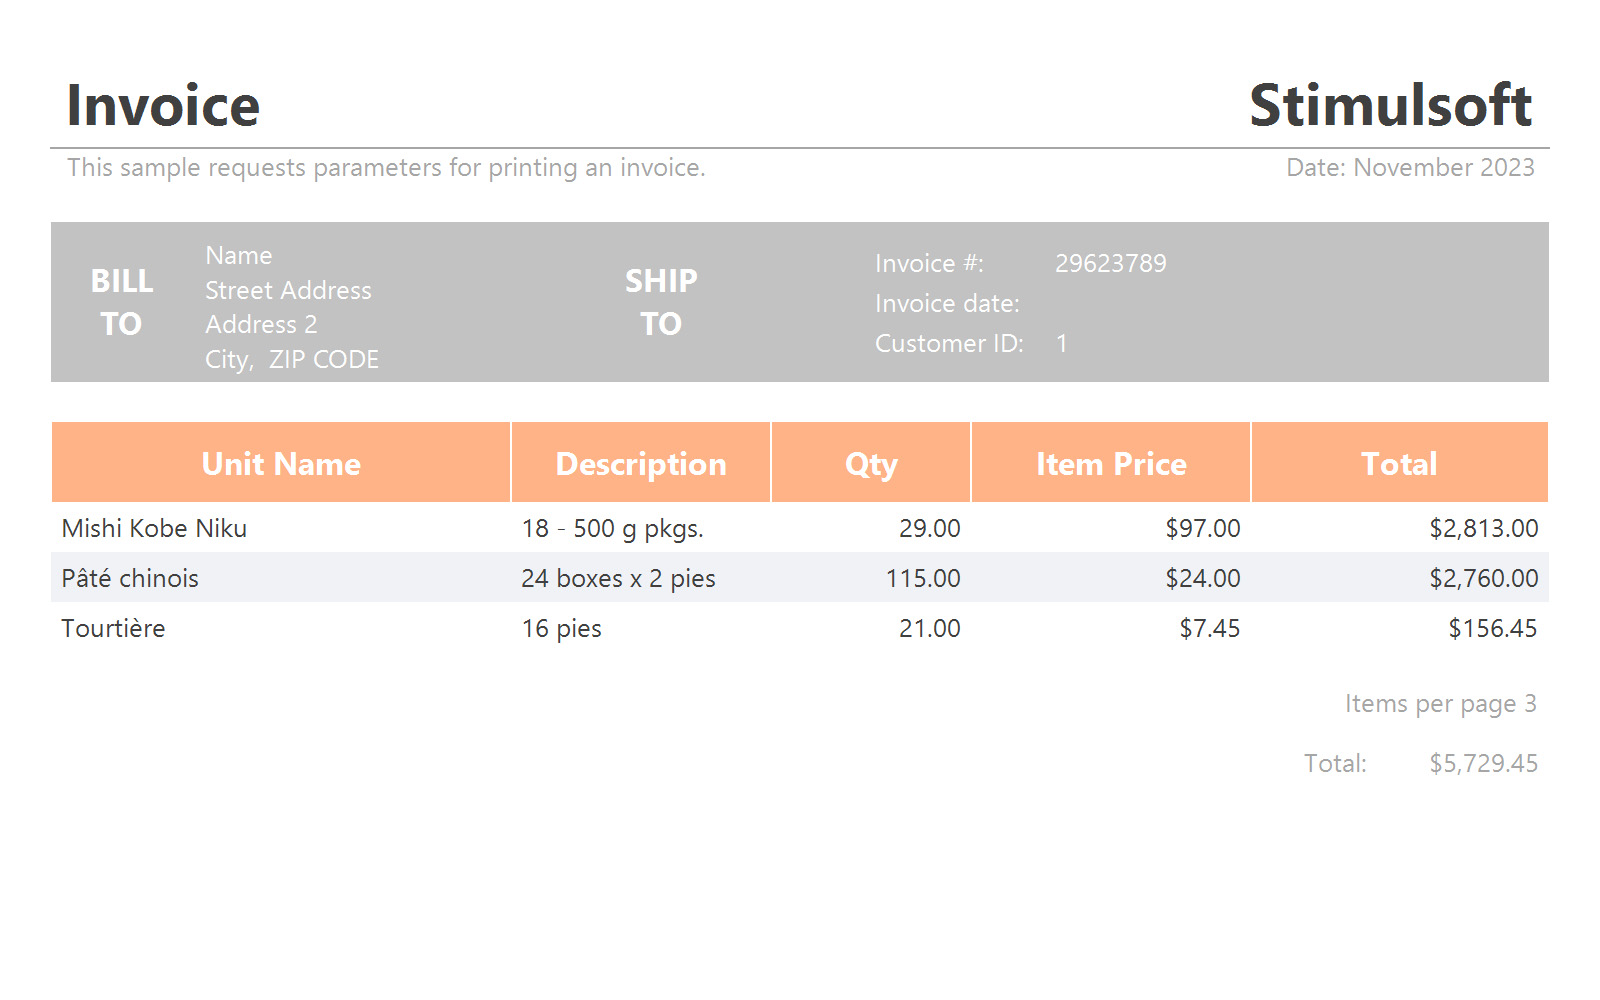
The screenshots above show that the report excludes rows with products having a quantity of 0, leaving no gaps. This can be attributed to the expansion of the Data band during the report-building process, where each data row is processed sequentially. At the moment of report generation, the reporting tool assesses the condition - whether to print a data line or not. If printing is unnecessary, it promptly moves on to the next line of data. Consequently, despite the presence of additional lines in the source, the current example prints the lines sequentially, without any skips.
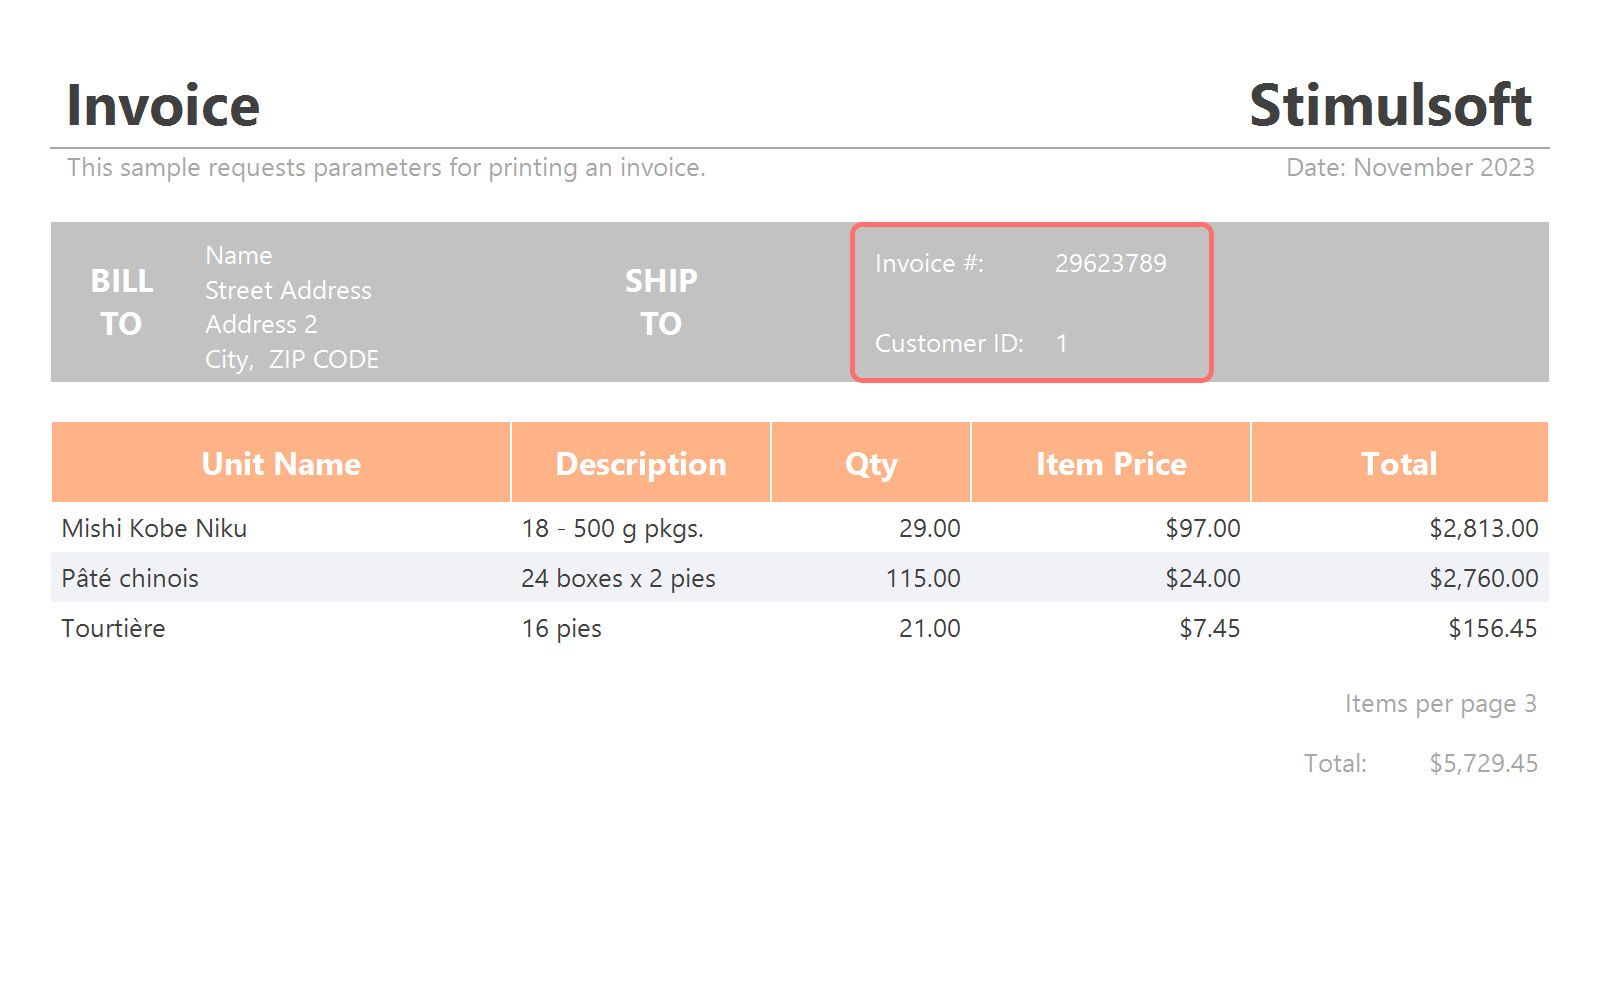
As you can observe, the disabled component is excluded from the report, maintaining its visual placeholder without displacing other components. However, consider the challenge of avoiding visual gaps, such as ensuring that the client identifier component appears immediately after the invoice number component. We are addressing dynamic behavior – scenarios where a component may or may not be present in the report. It's evident that if a component never appears, a simpler solution is to edit the template by removing it and arranging the remaining components in the desired order.
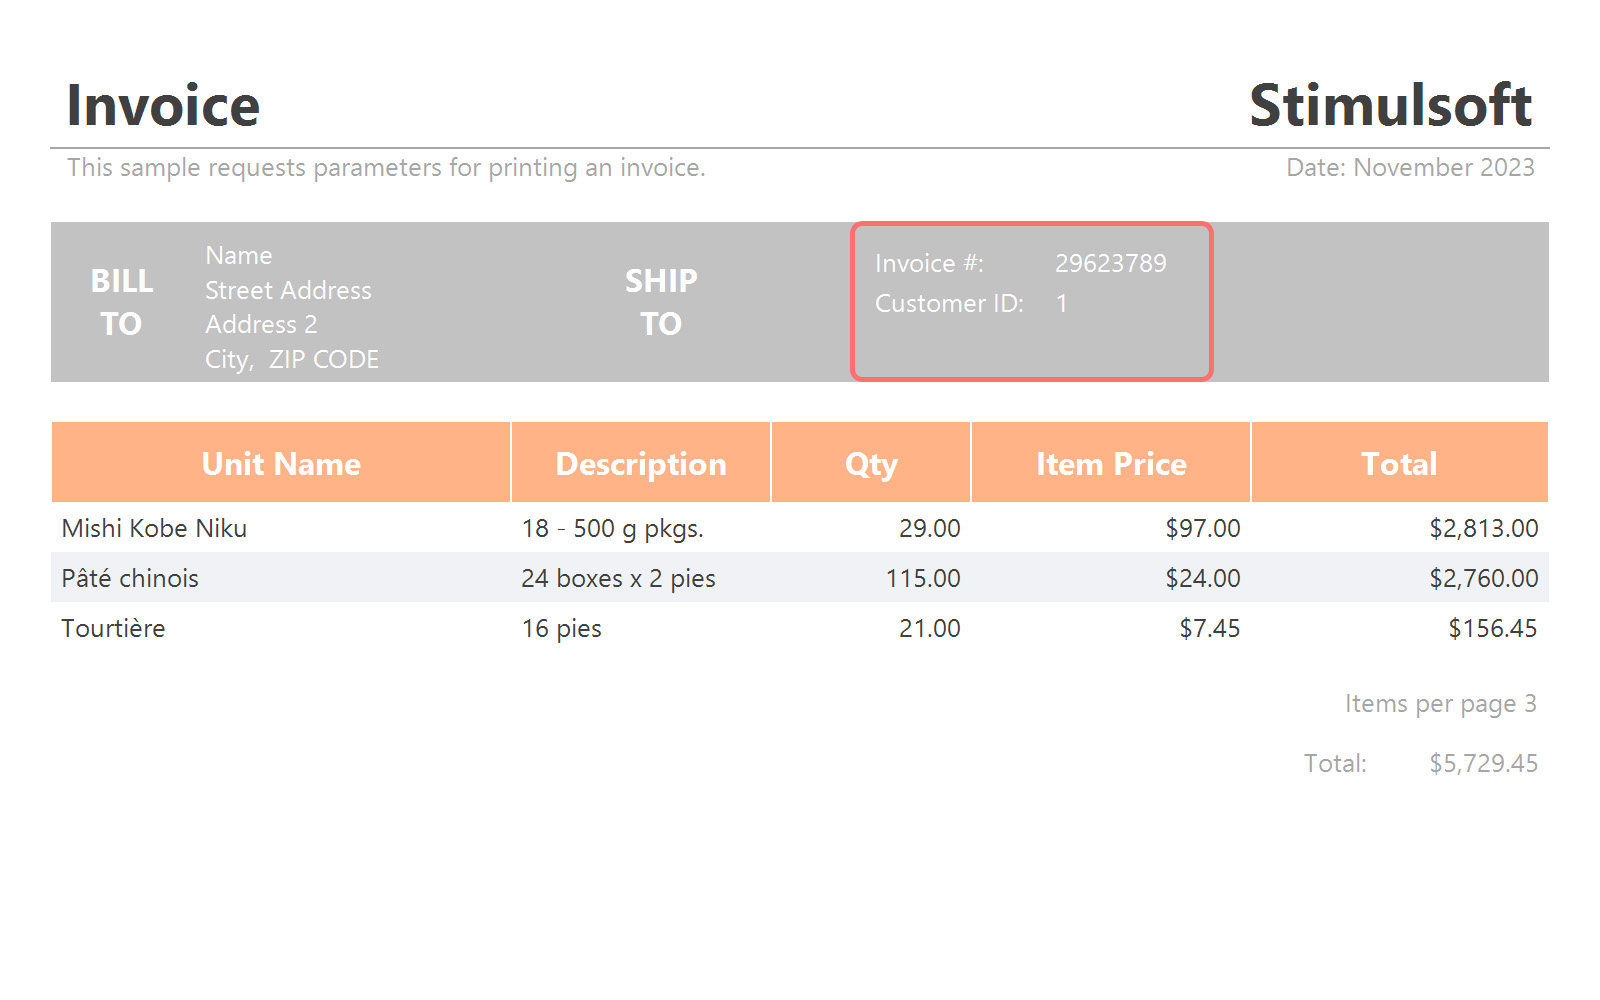
After this, if there is no component with the invoice date, the identifier component will be positioned immediately after the component with the invoice number. However, it's not all that simple. Enabling the Dock Style property triggers the following:
If, in this example, we had enabled the Dock Style property only for the component with the client ID and not the others, the report would have been constructed, but the desired effect would not have been achieved. Below is the report. Select a date in it.
We invite you to watch a video on our YouTube channel about disabling components when using conditional formatting.
Empty data
Consider a report containing a list of products (see screenshot 1). To exclude products with a quantity of 0, you can easily apply filtering to the Data band. For instance, add a filter with the expression Products.Count != 0 (refer to screenshot 2).The screenshots above show that the report excludes rows with products having a quantity of 0, leaving no gaps. This can be attributed to the expansion of the Data band during the report-building process, where each data row is processed sequentially. At the moment of report generation, the reporting tool assesses the condition - whether to print a data line or not. If printing is unnecessary, it promptly moves on to the next line of data. Consequently, despite the presence of additional lines in the source, the current example prints the lines sequentially, without any skips.
The problems with empty spaces
However, the example discussed above illustrates the rendering of bands in a report. The issue of empty lines and space arises when it is necessary not only to disable the entire band, but also to disable specific components within it that lack data. In the given example, on the invoice header band, we would disable the Invoice date component if no date is selected. As you can observe, the disabled component is excluded from the report, maintaining its visual placeholder without displacing other components. However, consider the challenge of avoiding visual gaps, such as ensuring that the client identifier component appears immediately after the invoice number component. We are addressing dynamic behavior – scenarios where a component may or may not be present in the report. It's evident that if a component never appears, a simpler solution is to edit the template by removing it and arranging the remaining components in the desired order.
Disabling components
Before we get to the point of docking, let's explore various methods to disable components. Each component comes with an Enabled property, which can be set to True, indicating the component is always enabled, or False, indicating it is always disabled. Moreover, you can define an expression whose calculation result yields a Boolean value. Consequently, by utilizing expressions, you can dynamically determine the availability of a component in the generated report. Lastly, you should know that components can be dynamically enabled or disabled through conditional formatting.Docking components
In general, combining components is quite straightforward. To achieve this, you simply need to set the Dock Style property to the appropriate value. In the example above, for components such as the invoice number, date, and customer ID, we will set the docking value to Top. Alternatively, you can choose from the values Left, Right, Bottom, and Fill.After this, if there is no component with the invoice date, the identifier component will be positioned immediately after the component with the invoice number. However, it's not all that simple. Enabling the Dock Style property triggers the following:
- The component is stretched in width to the borders of the container or adjacent components. In this example, components with the invoice number, date, and customer ID, along with their labels, can be found on a separate panel. The panel, in turn, is located on the Report Title band;
- The component is docked to the selected container border, in this case, from the top;
- Simultaneously, the reporting tool checks: if any component with the Dock Style property enabled is already docked to the container border, then the next component is positioned immediately behind it.
If, in this example, we had enabled the Dock Style property only for the component with the client ID and not the others, the report would have been constructed, but the desired effect would not have been achieved. Below is the report. Select a date in it.
Using a Child band
The Child band is a special band that serves as a continuation of the band after which it is located. A subordinate band cannot operate independently and, consequently, lacks its own data source. There are no restrictions on the number of subordinate bands in a report. While data may exist for the components in the Child band, the same might not be true for components in the subordinate band. In such cases, the subordinate band remains in the report, visually creating empty space. To eliminate this empty space, you can simply disable the band, either statically or dynamically, by specifying an expression for the Enabled property or by using conditional formatting to disable the band.We invite you to watch a video on our YouTube channel about disabling components when using conditional formatting.
In conclusion, disabling components and dynamically joining components in a report is straightforward; you just need to consider some aspects during template design. If you have any questions, feel free to contact us. We are always ready to help.