The end of December is the time to look back. In this article, we have collected all the most important things we did in 2022.


Starting from 2022, in Stimulsoft reporting products, you can:
On analytical dashboards, you can:
We have been making our products better
Added a new product Dashboards.BLAZOR
This is a cross-platform data analytics solution designed to be integrated into your applications running on the Blazor framework. The product works on the server- (Blazor Server) and client-sides (Blazor WebAssembly), quickly integrates into any web project, allows you to present and analyze data from multiple sources, and also has a wide range of tools for designing dashboards.Implemented compilation support in Blazor
Support for compilation mode for reporting when using the Blazor Server platform. Now you can use all the features of the reporting tool - runtime compilation, functions, and publishing reports as classes. The compilation is available on all supported operating systems.Added Razor Pages for .NET Core components
Razor Pages allow you to create pages with code that can handle various requests. Now all the tools for creating, displaying, and converting reports and dashboards using this technology are available. We included this functionality in Reports.WEB and Dashboards.WEB products.Updated components for
JavaScript
For Reports.JS and Reports.PHP, Dashboards.JS and Dashboards.PHP products, we implemented support for different screen scales, all themes and component styles have been transferred from CSS files to JS scripts, and all images used in JS products have been converted to WebP format. All these improvements made it possible to reduce the size, and as a result, increase the speed of the product.PHP
We added support for the Composer dependency manager. Now, to install the product in a project, it is enough to execute one command, and all the scripts and resources of the product will be downloaded automatically from the Packagist repository. A complete refactoring of the PHP code has also been made. For the main features - loading, exporting a report, viewing in the viewer, and editing in the designer, you do not need to write JavaScript code. We have added appropriate classes and enumerations to program these actions using only PHP code.Blazor
The Blazor components in Reports.BLAZOR and Dashboards.BLAZOR have been significantly updated. The internal structure of the components has been improved - now, all their work is done in asynchronous mode. This made it possible not only to significantly increase the loading speed and performance of components but also to add new features. In the case of developing an application using WebAssembly technology, the loading speed of all page elements has significantly increased. The ability to display components in pop-up windows of a “One Page App” web application has also been improved.Used new technologies
Transition to ECMAScript 2017
In 2022, we switched Reports.JS and Dashboards.JS to the new locale ECMAScript 2017. This increased the processing speed of a multi-page report by more than 25%. New features in ES2017 remove barriers to our product development and allow us to keep up with the times..NET 6.0 and Angular 11, 12, 13 in the Publish wizard
We have updated the Report Publish wizard so you can specify the .NET 6.0 framework version for your projects. This option is available in the ASP.NET MVC, WinForms, WPF, and Blazor frameworks in the Publishing Wizard. In addition, we added support for all versions of the popular Angular framework, including the current ones - 11, 12, and 13.Compatibility with .NET 7.0 and PHP 8.1
We tested the Reports.PHP and Dashboards.PHP products under PHP 8.1, and Stimulsoft components with platforms such as ASP.NET Core MVC, ASP.NET Core Razor, WinForms, WPF, and Blazor running under the .NET 7.0 framework. Tests were successful, and we are ready to announce the full compatibility of our reporting and data analytics tools with new technologies.Added new charts
Pictorial Stacked Chart
You may use this chart to display the relative share of a value in an overall indicator. Any icon from the list can be presented as a graphic element of the chart.Ribbon chart
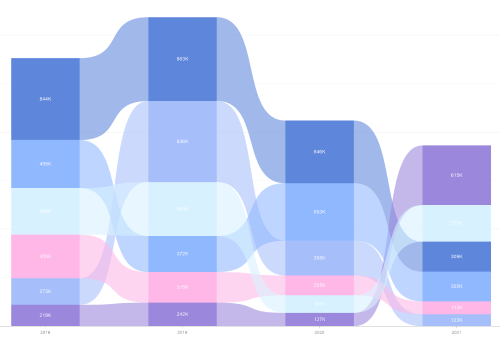
This chart type is an improved version of the stacked chart. The values for each argument are sorted from largest to smallest, and a curve (a ribbon) is drawn between the argument values, which allows you to visually estimate the trends and trends of indicators during analysis.New 3D charts
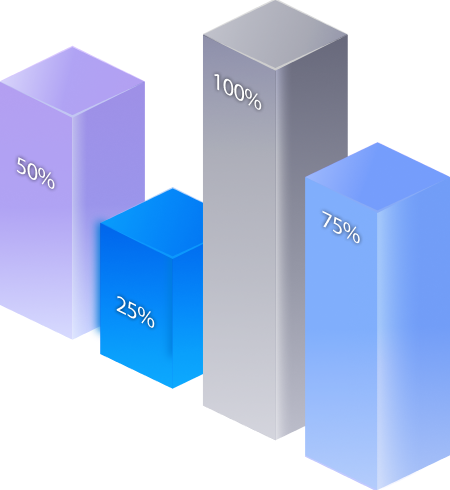
Reports and dashboards now have new charts - 3D Clustered Column, 3D Stacked Column, and 3D Full-stacked Column. The geometry of the series of graphics objects can be defined as Rectangle, Pyramid, and Partial Pyramid.Connected new data sources
GraphQL
We added the ability to retrieve data from various storages using the GraphQL query model. Select the GraphQL item from the REST tab in the New Data Source window, and specify the URL to the data store and the query text. After receiving the data, you can design reports and dashboards based on it.Expanded the functionality for building reports
- customize the appearance of QR barcodes and add GS1 barcodes to reports;
- leave electronic and digital PDF signatures in the document;
- monitor SQL queries using the data monitor;
- display categories and variables on the options panel in the viewer;
- and much more.
Expanded the possibilities of displaying data on dashboards
- use animated images;
- execute certain scenarios with the help of an interactive Button;
- group data in Cards;
- visualize Tooltip for some dashboard elements - Chart, Regional Map, and Indicator;
- and much more.
Thank you for being with us! See you in 2023!
Best regards from Stimulsoft.
Best regards from Stimulsoft.