We are pleased to announce the release of Stimulsoft Reports and Dashboards version 2023.1! We have added support for Razor Pages for .NET Core components, updated components for the PHP and Blazor platforms. Also, we added the new Data Monitor visual tool and implemented the ability to reset all filters. This list of changes is not complete. Please read this article to find more new features that help you work with your data efficiently and quickly.
Please note that categories can only be displayed in the vertical options bar. On the horizontal one, categories will not be displayed, and all variables will be located, as before, in a simple list.
In addition, it became possible to change the main options of components, such as localization or theme, at any time after they were created. Also, we improved the ability to display elements in pop-up windows of web applications built on the "One Page App" principle.

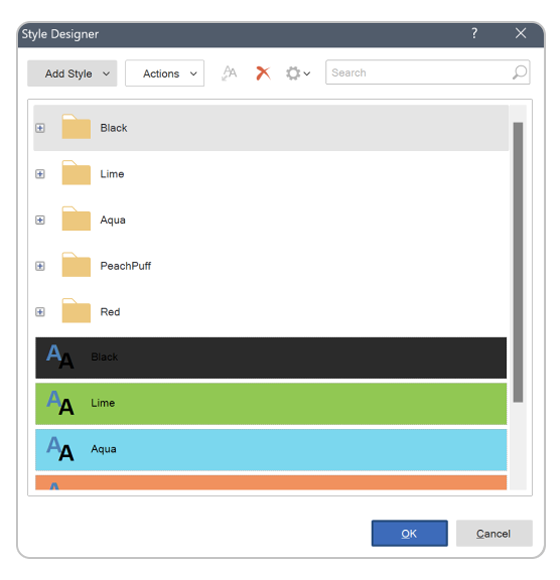
However, they will only be saved if you click OK in the style designer. In addition, we added the ability to assign a style to a component by dragging this style onto a report or dashboard component.
Razor Pages
In release 2023.1.1, we added support for Razor Pages for .NET Core components. Razor Pages allow you to create pages with code handling various requests. This technology makes creating scripts for pages more manageable and more efficient than using an MVC solution. All tools for creating, displaying, and converting reports and analytical panels (dashboards) using this technology are available. This feature is implemented for Reports.WEB and Dashboards.WEB.Categories of variables in the viewer
Starting with release 2023.1.1, we added the functionality to display categories and variables on the options panel in the viewer. Previously, categories could only be used when designing a report to group variables in a data dictionary, and it was impossible to display this ordered structure in the parameters panel. Now you can structure the order of the parameters by categorizing them and enabling the category visibility mode. Setting the visibility of a category and defining its state is carried out in the editor of this category.Please note that categories can only be displayed in the vertical options bar. On the horizontal one, categories will not be displayed, and all variables will be located, as before, in a simple list.
Updated Blazor Components
We have completely updated the Blazor components in Reports.BLAZOR and Dashboards.BLAZOR. We improved the internal structure of the components - now, all their work is done in asynchronous mode. This made it possible to significantly increase the loading speed and performance of components and add new functionality. In the case of developing an application using WebAssembly technology, the loading speed of all page elements has increased considerably.In addition, it became possible to change the main options of components, such as localization or theme, at any time after they were created. Also, we improved the ability to display elements in pop-up windows of web applications built on the "One Page App" principle.

Updated PHP components
We have made significant changes in Reports.PHP and Dashboards.PHP in this release. We have added support for the Composer dependency manager. Now it's pretty easy to install the product in the project - run just one command, and all the scripts and resources of the product will be loaded automatically from the Packagist repository. Also, a complete refactoring of the PHP code has been made. You do not need to write JavaScript code for basic features, such as loading, exporting a report, viewing, and editing in a designer. Appropriate classes and enumerations have been added to program these actions using only PHP code. At the same time, for backward compatibility, all actions can be programmed using JavaScript code.Data Monitor
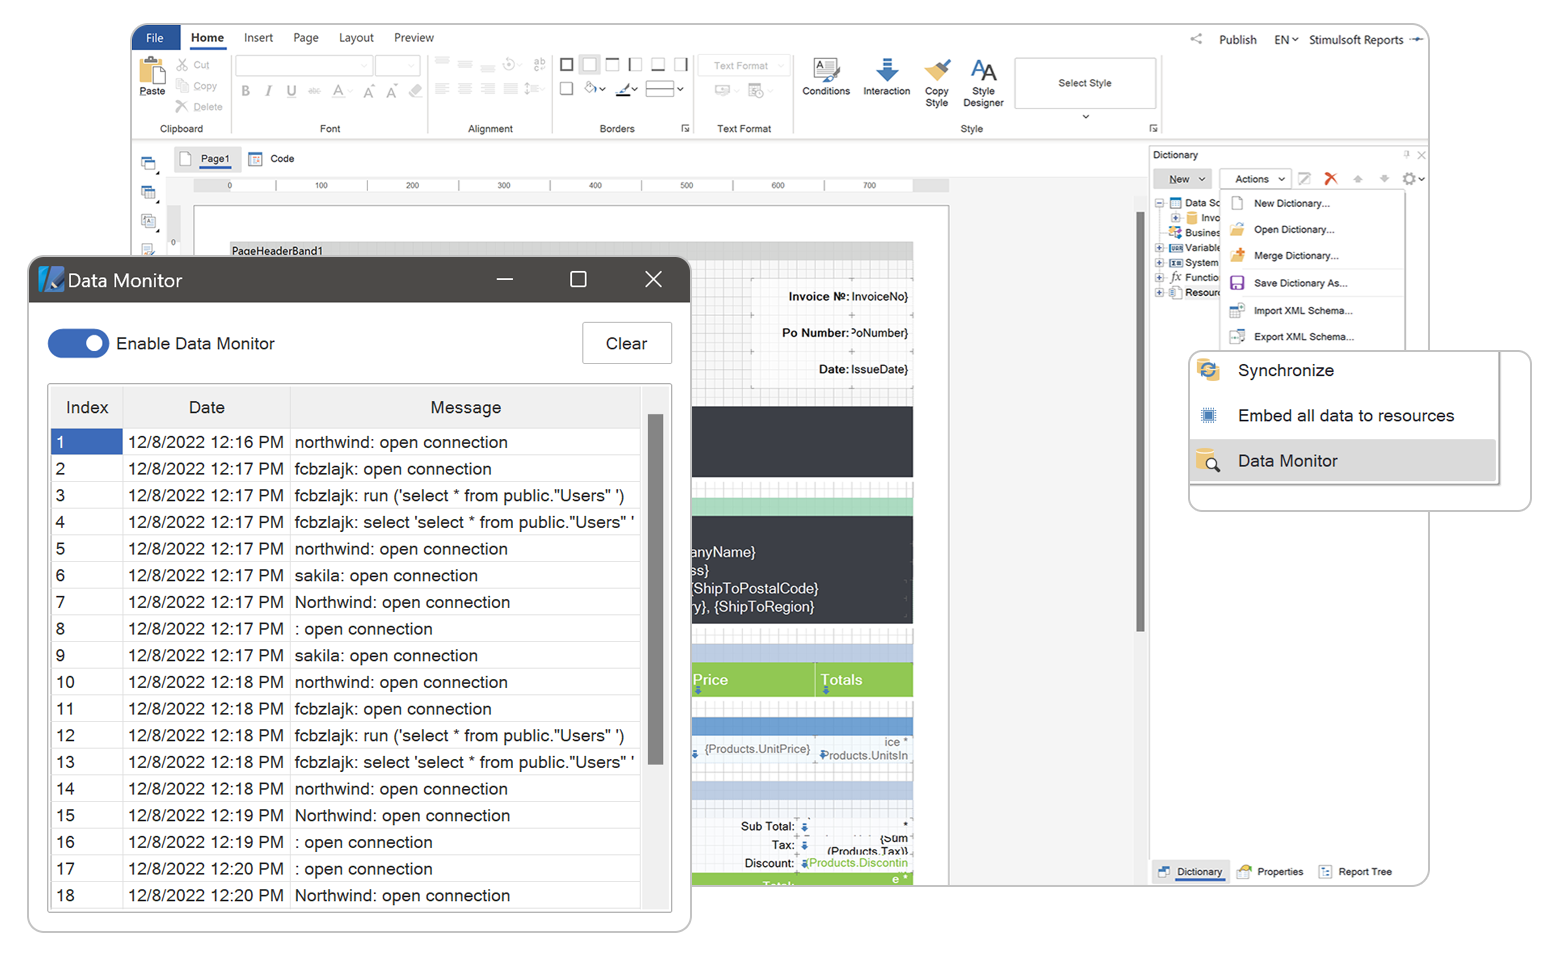
In release 2023.1.1, for reporting tools based on the .NET platform, we added the ability to monitor report generator SQL queries to various data sources in real-time. This is implemented using a particular StiDataMonitor class. In addition, a visual tool, the Data Monitor, has been added to the Stimulsoft Designer application. To invoke this tool, select the Data Monitor command from the Actions menu of the data dictionary.
Report culture expressions
We added support for expressions in the report calculation mode as Interpretation for the Culture property. Thus, it is now possible to define the localization language of a report or dashboard based on the result of the expression calculation. For example, in the Culture property, you can use a variable as an expression that contains a list of required cultures and waits for the user to select a value. As a result, after clicking the Submit button on the options panel of the viewer, the report will be localized with the selected culture.Reset all filters
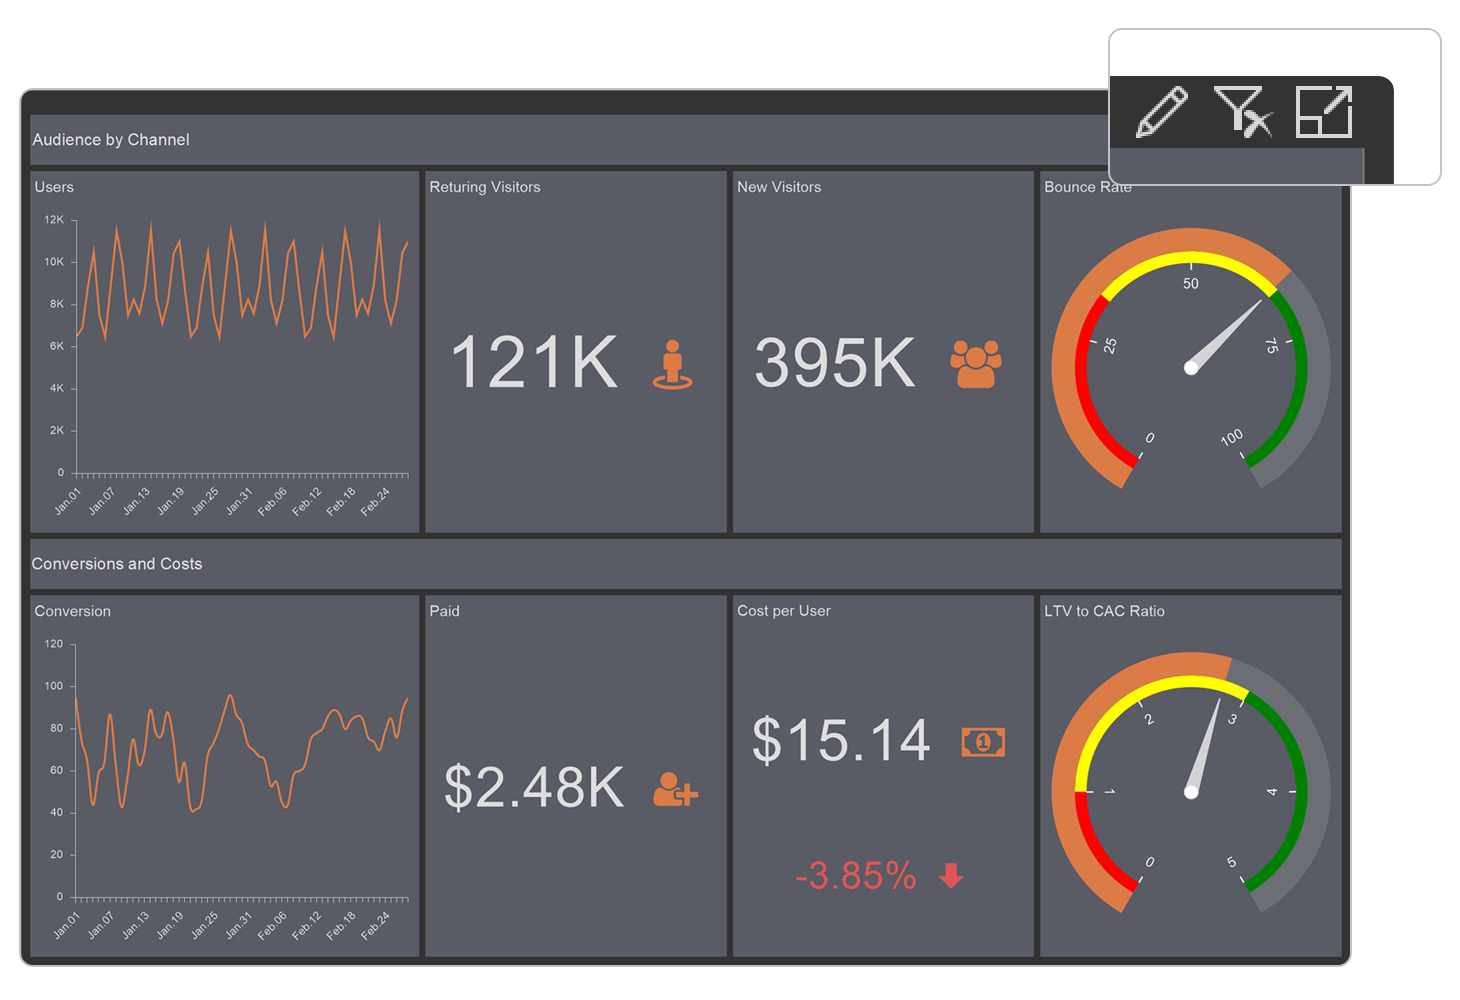
When viewing dashboards, you can reset all element filters to their default state with one click. For this, a special command Reset All Filters is used on the toolbar of the viewer. The visibility of this command on the toolbar is controlled in the Preview Settings property of the template. For dashboards created in earlier versions, the visibility of this button is disabled by default.

Viewer Toolbar Alignment
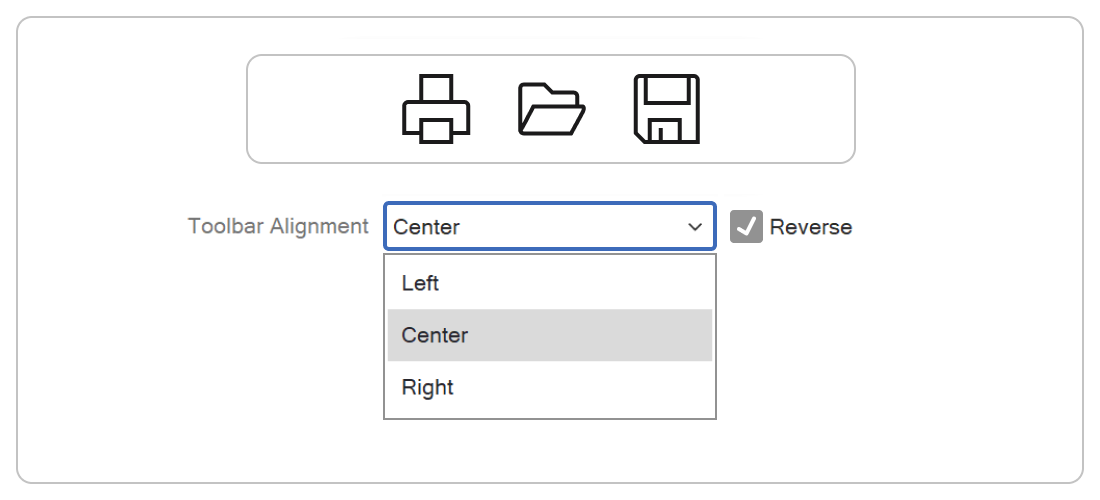
We added flexibility in setting up the viewer for a specific report template or dashboard. You can now change the horizontal position of the toolbar and define it as left, right, or center. The Preview Settings property of the template specifies the location of the toolbar. Also, you can display the commands and controls of the viewer toolbar in reverse order by turning on the reverse mode.GIF support in dashboards
We added support for animated GIF images in dashboards in the new version. You should use the Image component to add GIF files to the dashboard. Animated images in this component can be loaded from a file or added via a hyperlink.
The updated main menu of the designer
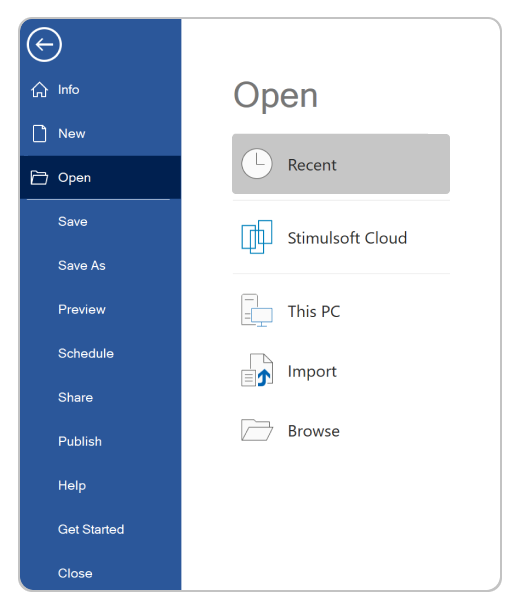
In the report designer, we have completely redesigned the menu used to open and save reports, adapting them to the style of Microsoft Office. We have added search capabilities, pinning frequently used reports, specifying local storage, and more.Updated Style Designer
We optimized and improved tools for reports and dashboards for creating styles. The changes will be displayed in the report template or dashboard when editing the style settings.However, they will only be saved if you click OK in the style designer. In addition, we added the ability to assign a style to a component by dragging this style onto a report or dashboard component.
