We are pleased to announce the release of the new version Stimulsoft Reports 2018.2 which is now available for download. We have prepared a number of changes that you will be able to immediately use in your projects. The most important changes are expanded functionality for work with resources, custom fonts, the new style editor, access to reports and many others.
Resource Panel in Viewer
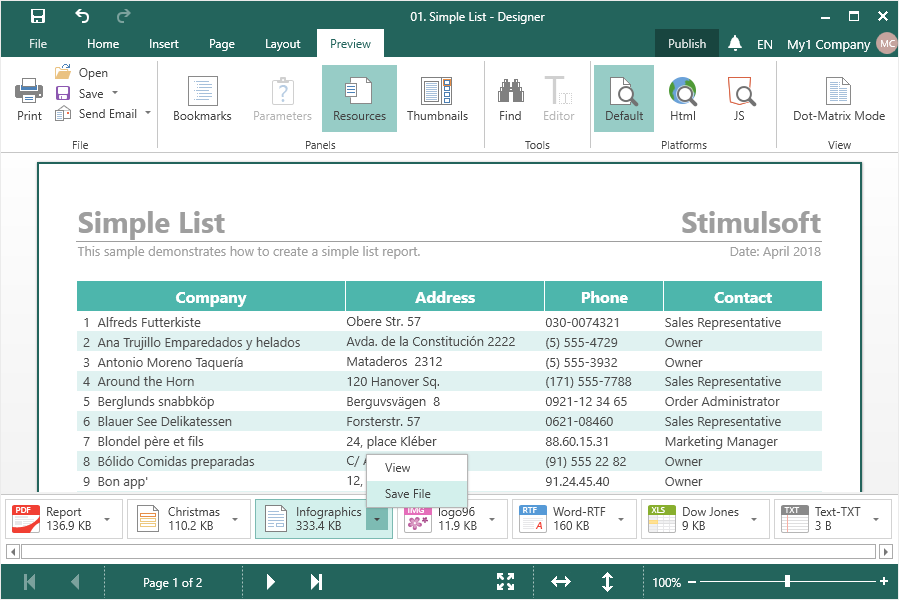
Now documents (PDF, Word, Excel, etc.) and images added to the report resources can be displayed in the viewer. To do this, select the checkbox for the Available in the Viewer option in the Edit Resource dialog or when creating it. After that, this resource will be displayed in a separate panel in the viewer window or in the preview tab. Also, it can be viewed or saved to a file in the viewer.
Custom Fonts in Reports
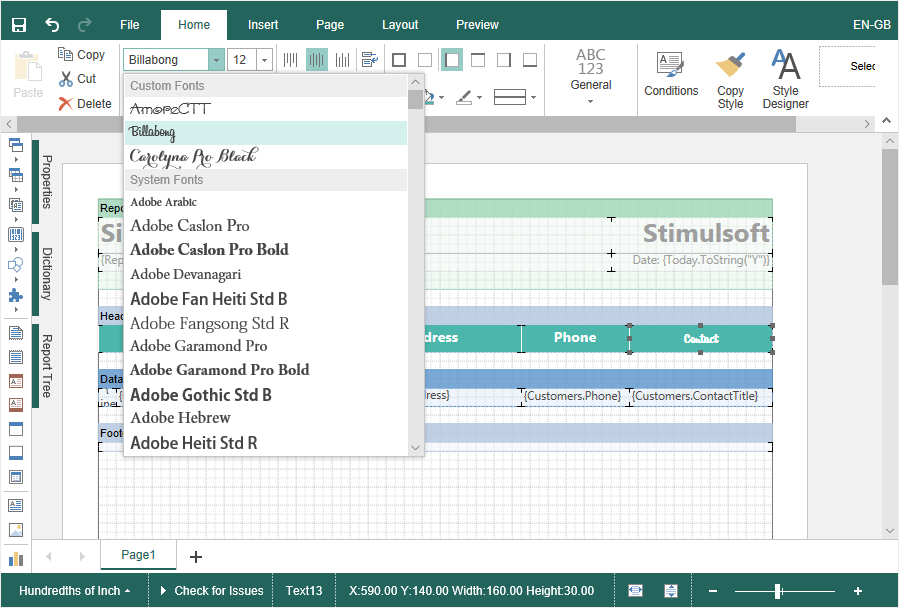
The release of 2018.2, we added the ability to use custom fonts in the report. To do this, drag the file with fonts (ttf, otf) to the Dictionary of the report. In the font collection, you will add custom fonts that you can apply to the text components of the report.
New Style Editor
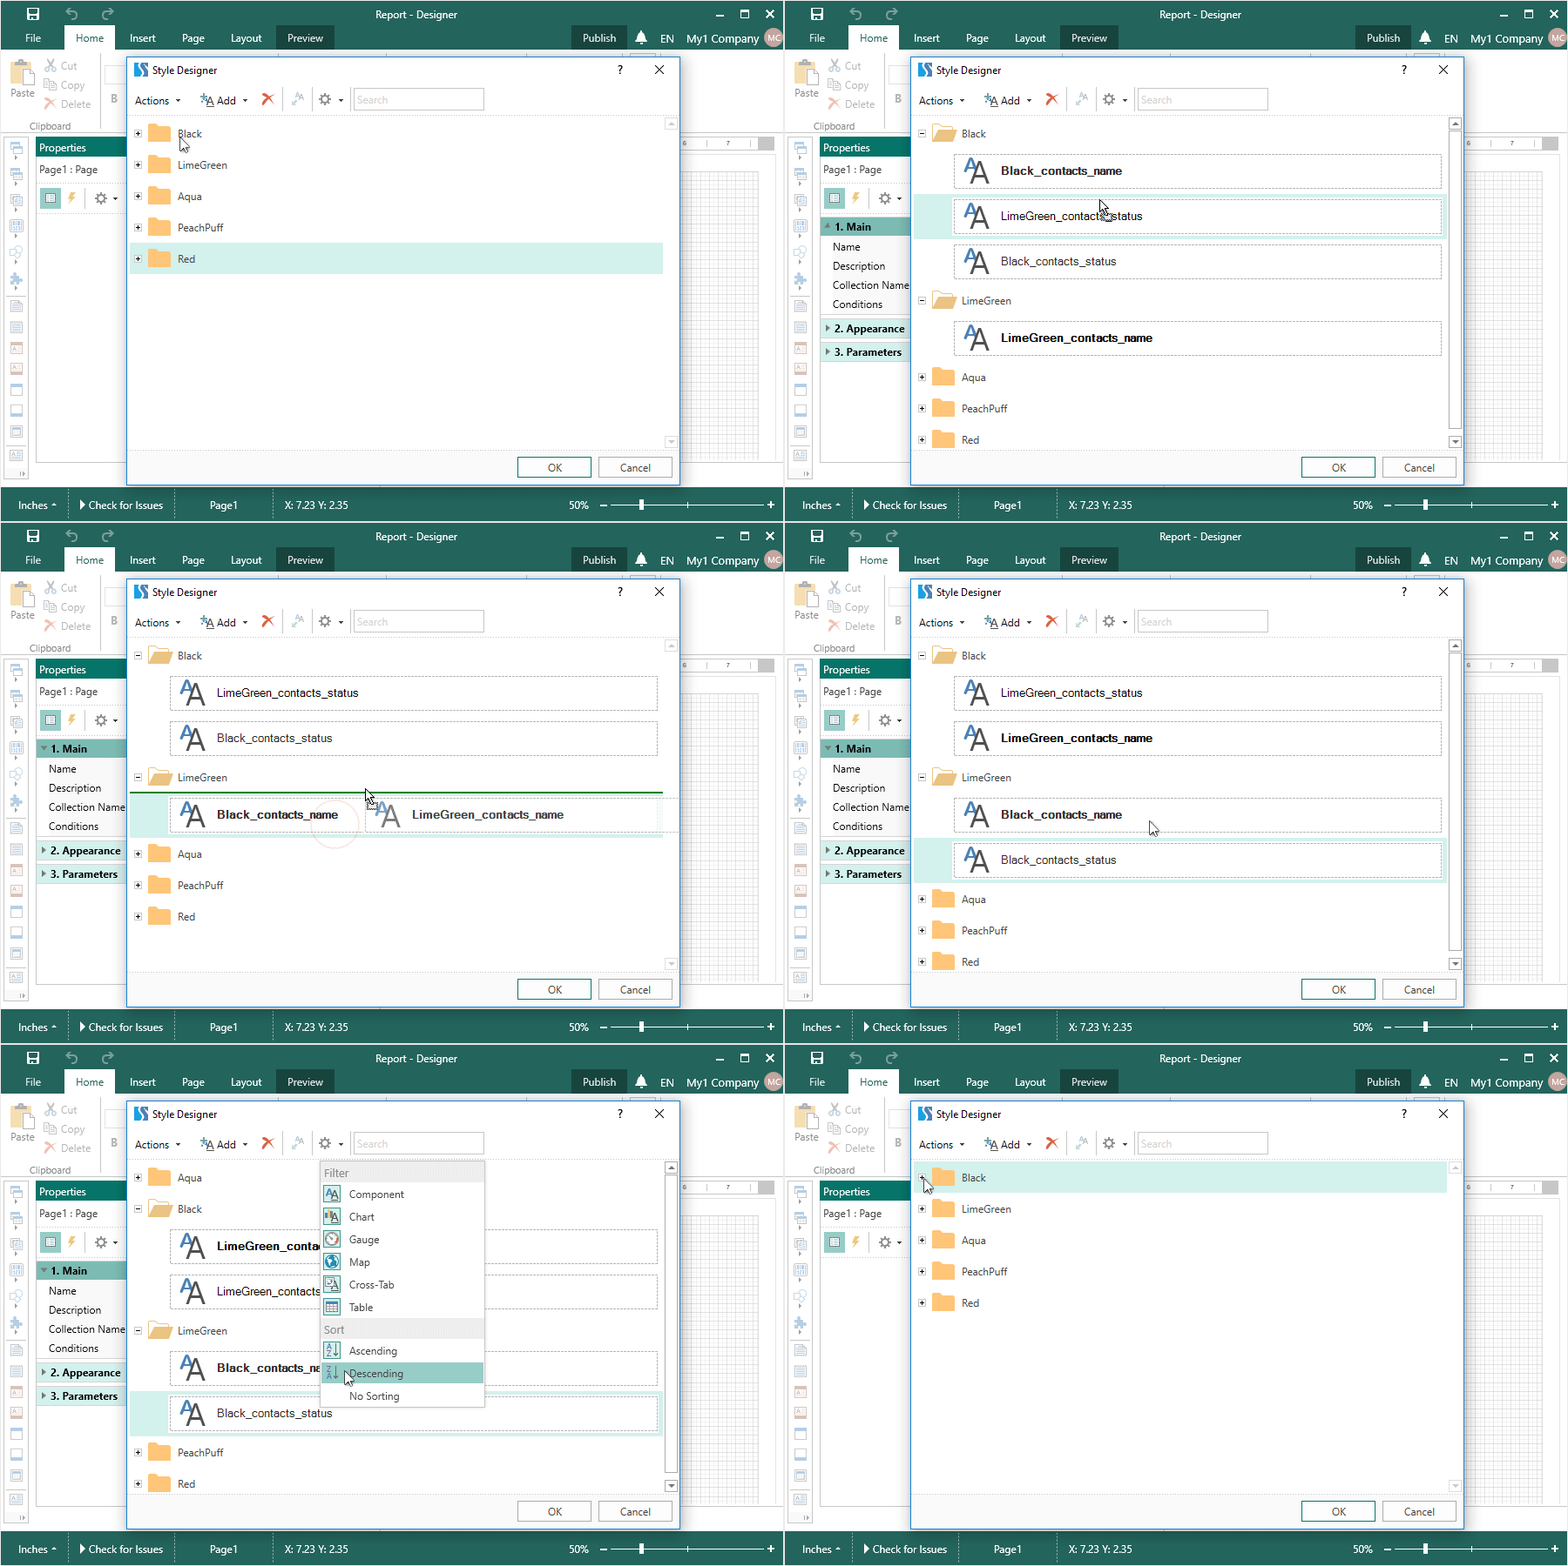
We have completely redesigned the style editor. Collections and styles are now displayed in a hierarchical form. Use drag’and’drop to change the collection for the style. Also we added filters and sorting styles. In addition, all the styles used in the report are checked with markers in the style editor. Also, search of a style by name or part of name is added.
Refresh Time for Reports
Starting with release 2018.2, you can define the time interval after which the report will be rebuilt. In addition to the preset values, you can enter custom values in seconds.

Access to Reports
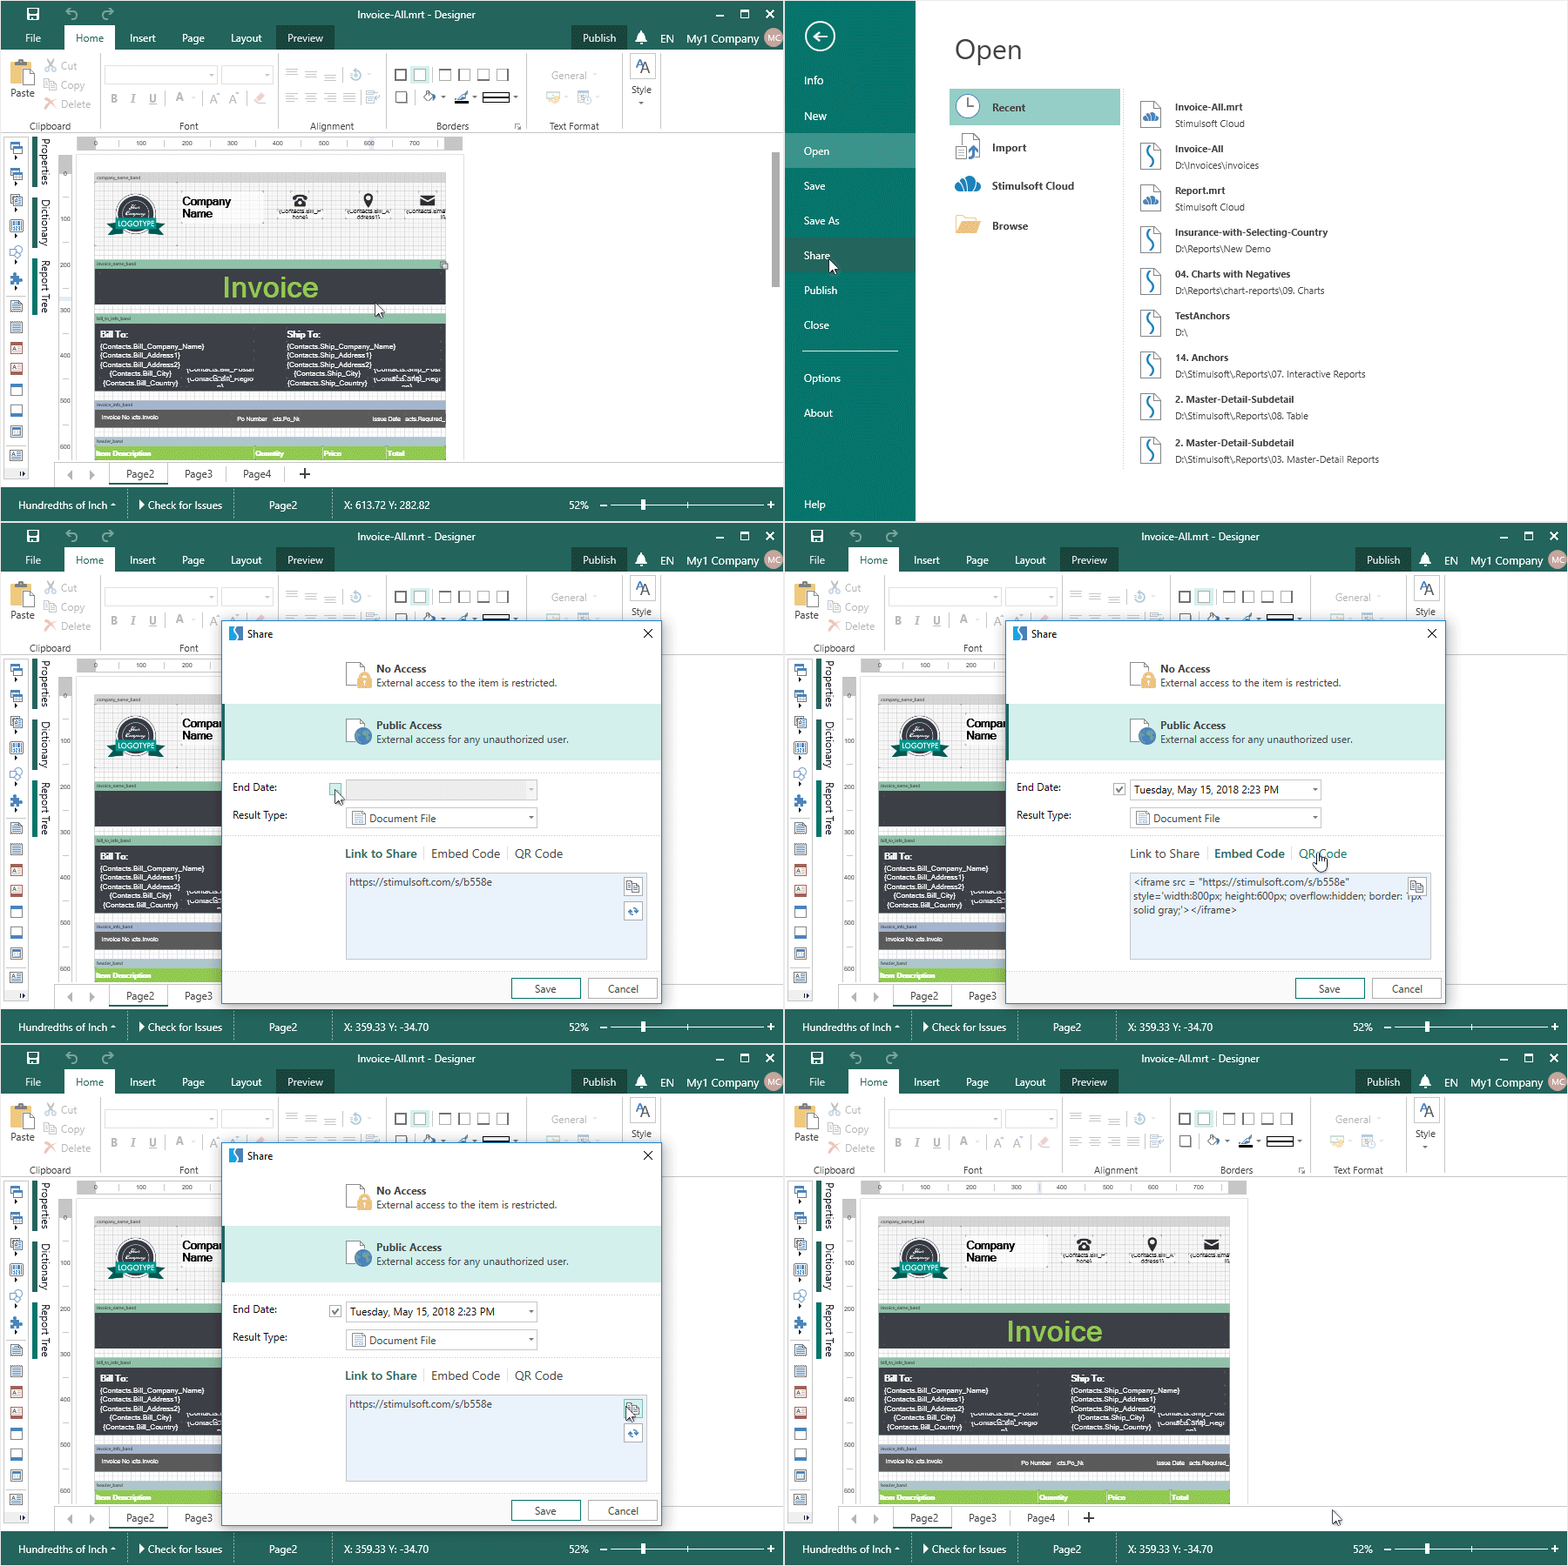
In the release 2018.2, you can configure remote access to the report preview from the report designer. To do this, select File -> Share. Save the report in Stimulsoft Cloud, set the access settings and view the report remotely by reference, by the barcode or embed the report code in your HTML page.
Sub-reports from Resources
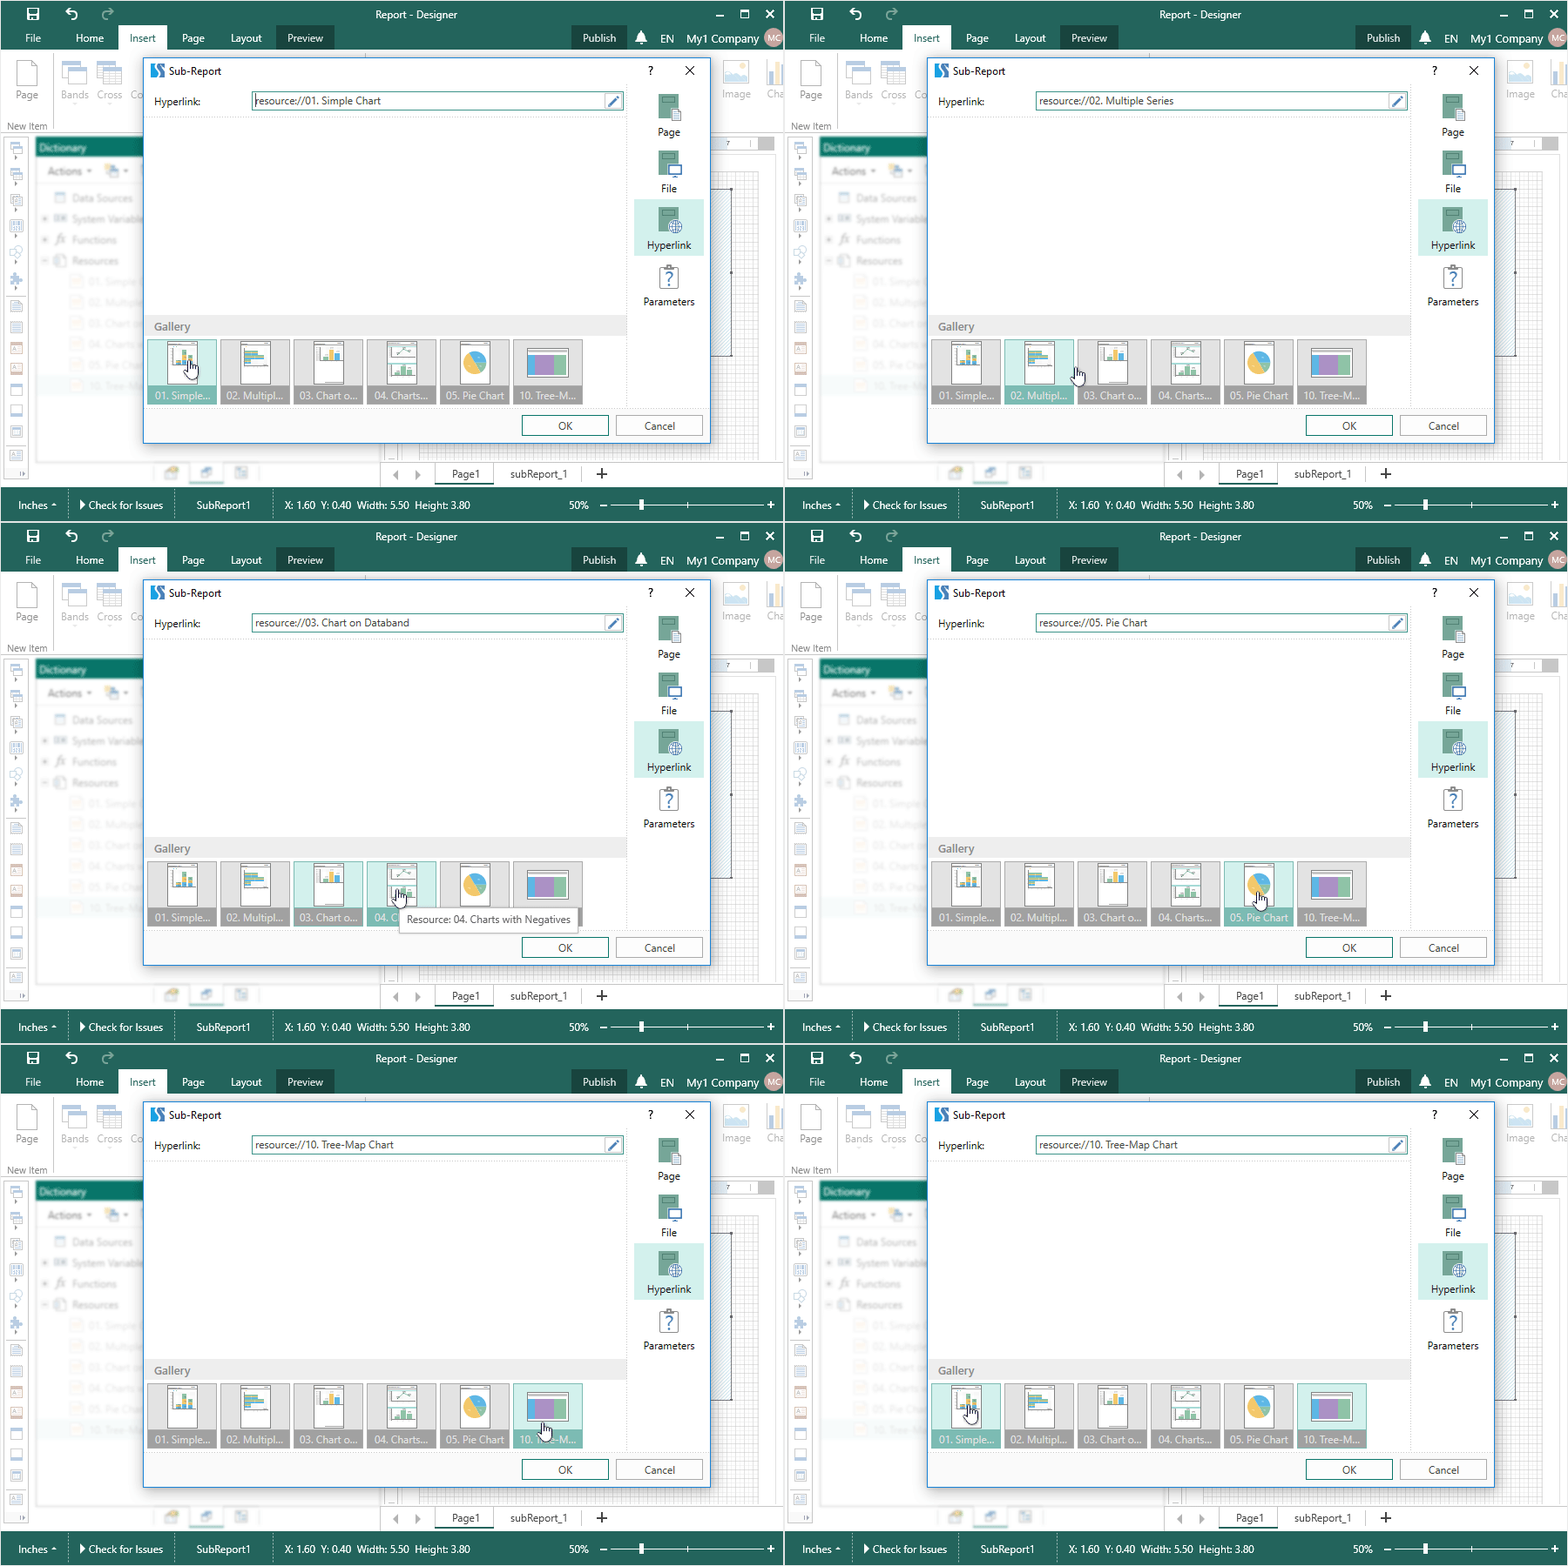
Starting with the release 2018.2, you can add other reports (mrt, mrz, mdc, mdz) to the report as resources, and use these built-in reports in the Sub-Report component. To do this, in the Hyperlink tab in the editor of the sub-report, select a report from the resource gallery or specify a link to the resource manually.
Interactive Chart in Reports.JS
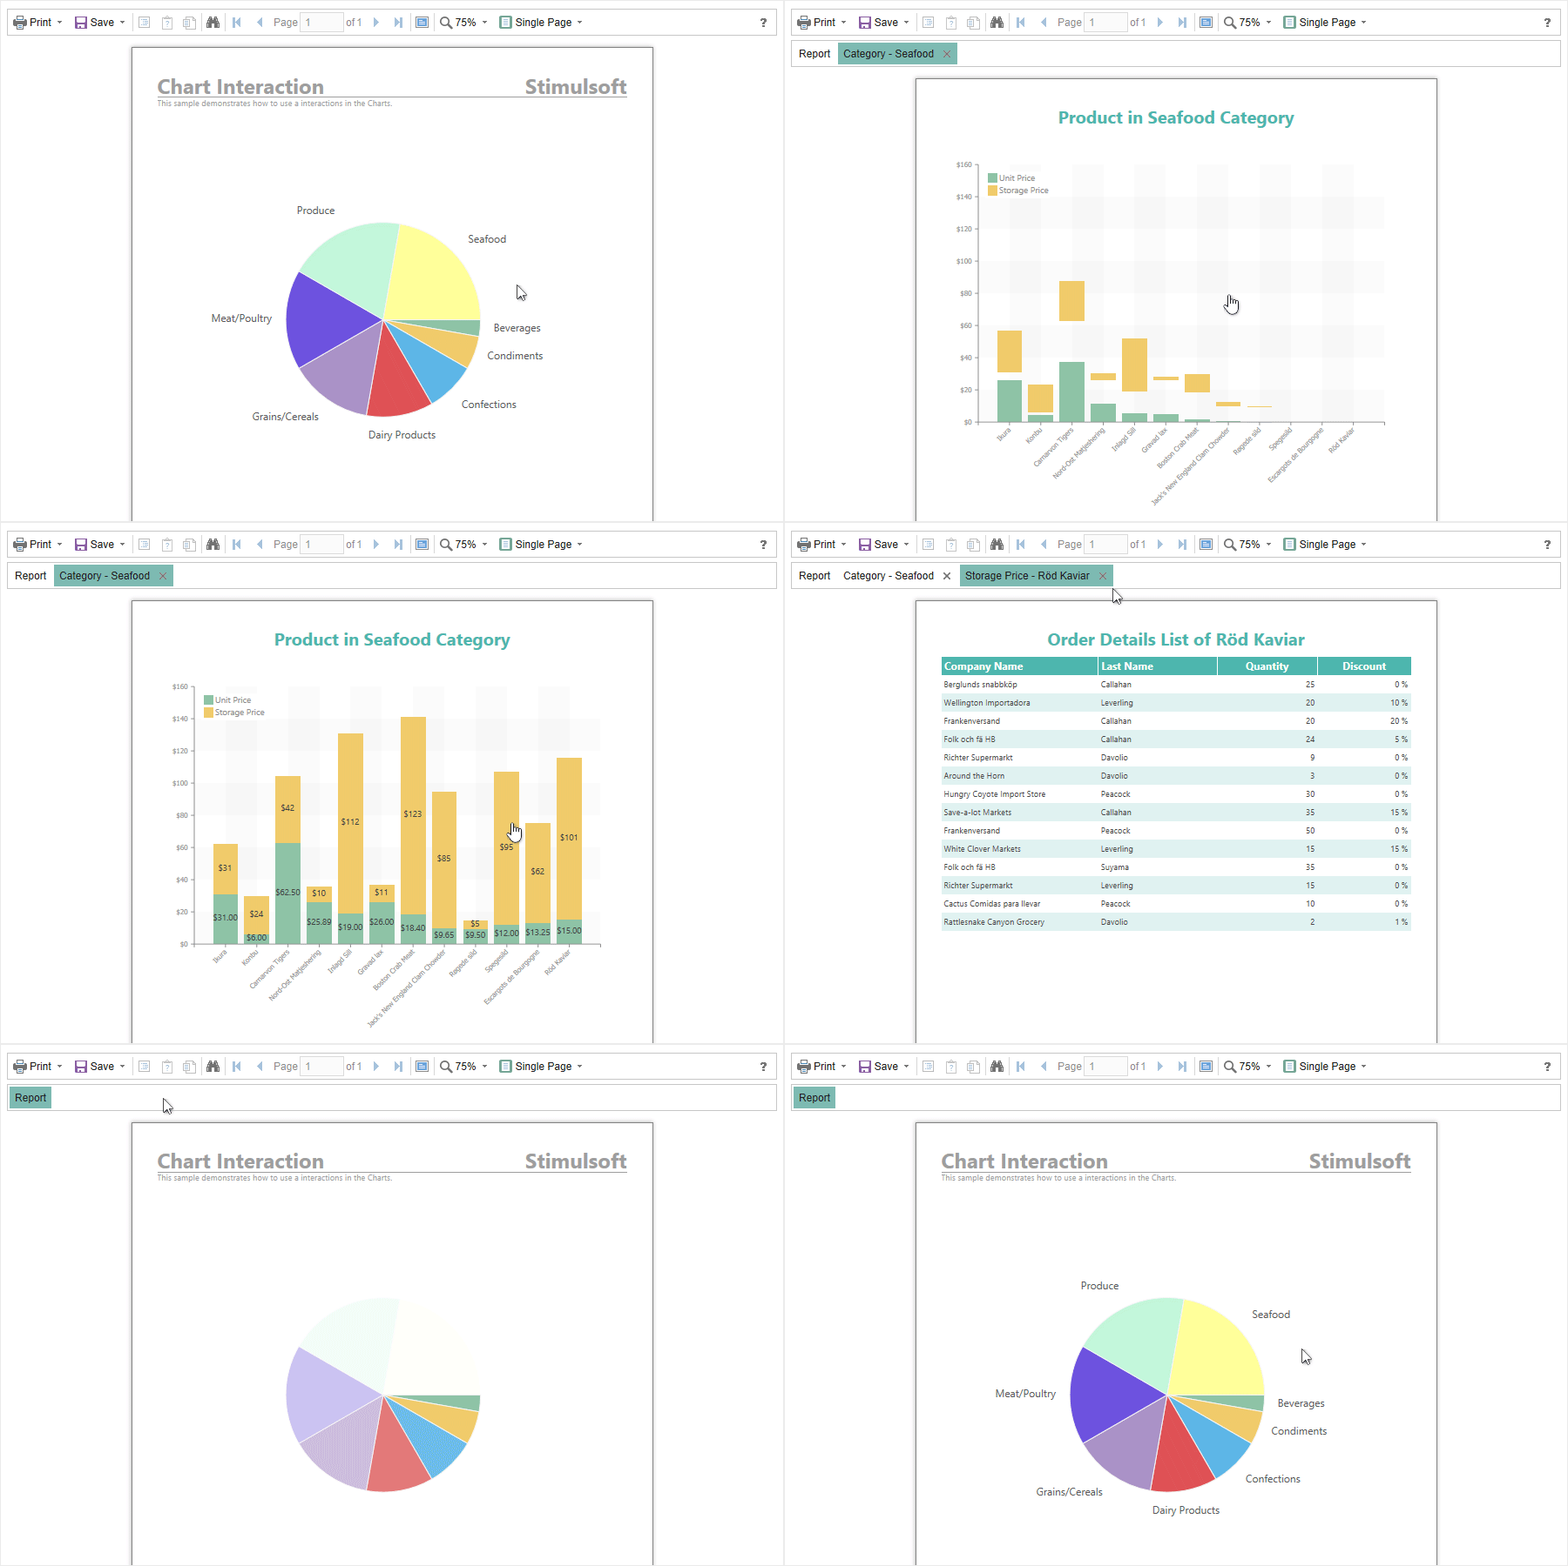
Starting with the release 2018.2, you can view reports with interactive data in the charts. Interactivity of data can be organized from a chart to a diagram, from a chart to other components of a report, from other report components to a chart. Interactivity of charts works in both the Web viewer component and in the preview tab in the report designer.
Text Files in Report Resources
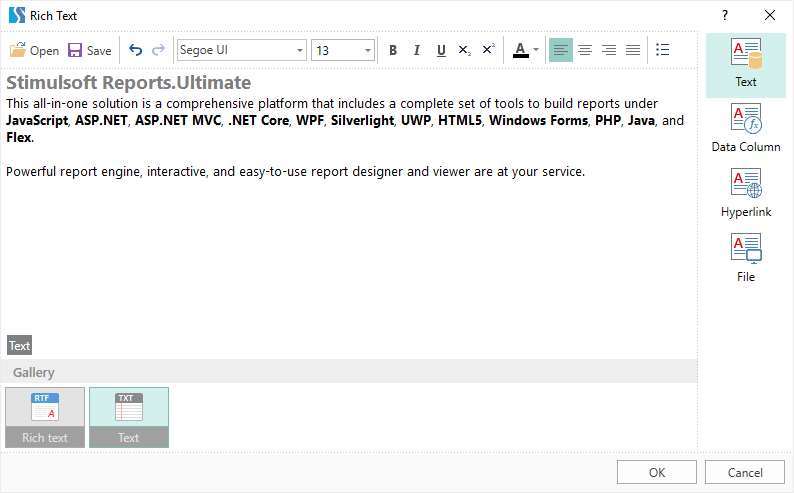
You can add text files (txt, rtf) to the report resources, and then display them in the report using the RichText component. Add text files to the resources, then open the RichText component editor text and select a text file from the resource gallery.
Dragging Data to a Dictionary
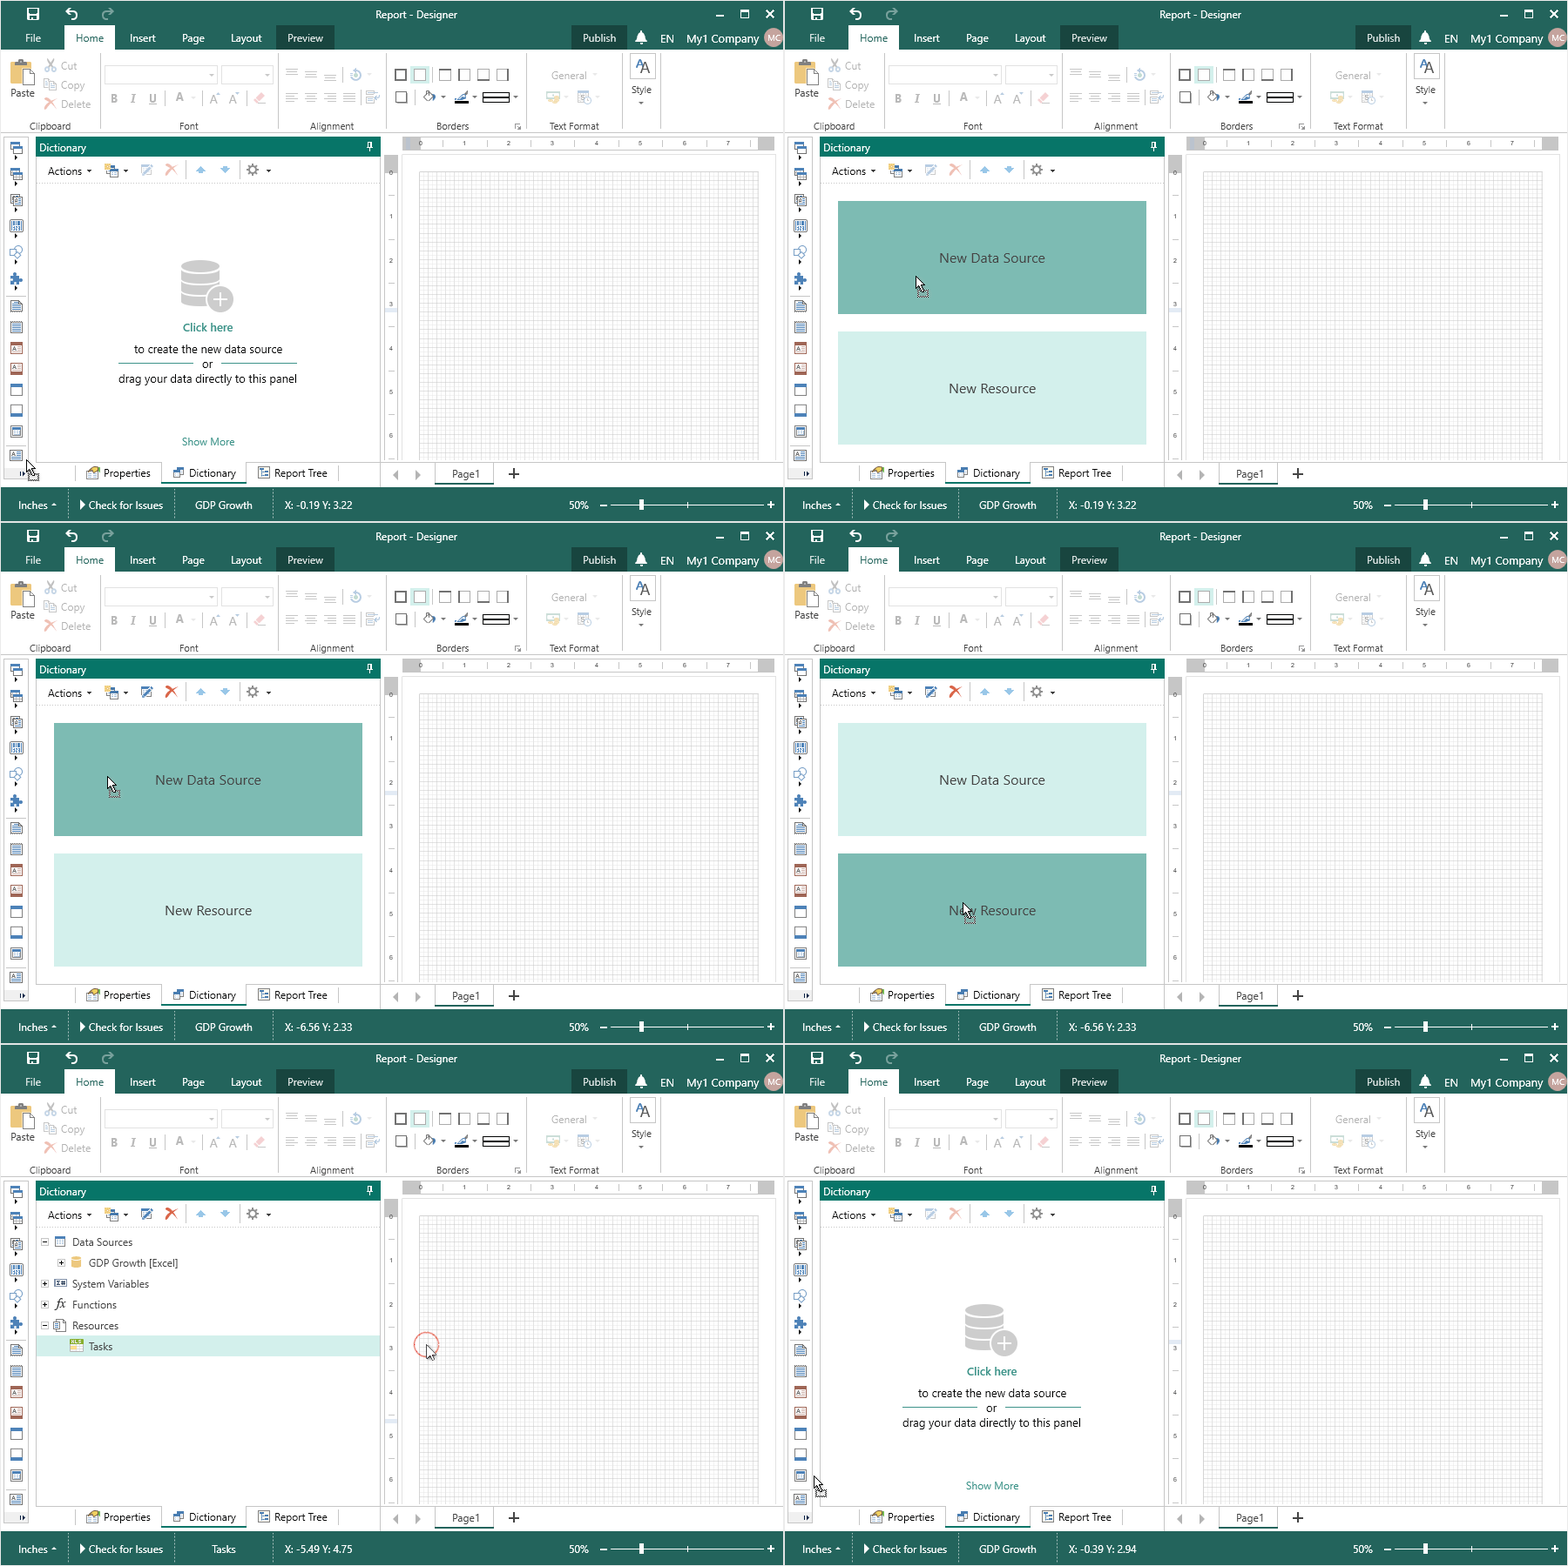
When dragging a data file into the dictionary, there are various options for adding it. If the file is dragged to the top of the dictionary, a new data source will be created based on this file. If you drag the data file to the bottom of the dictionary, the data file will be added to the report resources.
Move to Resources Command
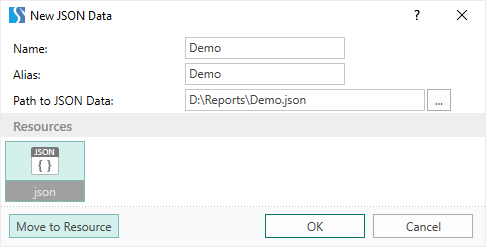
When creating file data sources, you can move them to report resources. To do this, click the Move to Resource button in the New Data window. After that, the data file will be added to the report resources, and the data source will be created based on this resource. In addition, for DBF and CSV data sources, you can specify the path to the repository with multiple CSV and DBF files. In this case, when you click the Move to Resources button, all CSV and DBF files from the specified repository will be added to the report.
Saving Resources
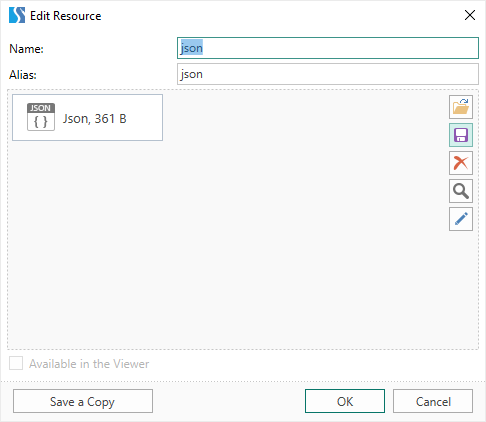
In the release 2018.2, the ability to save resources to a file is added. To do this, click the Save button in the Edit Resource window. The resource will be saved to a file of the same type that it was before the report was added.
New Command for Resources
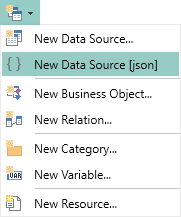
The new New Data Source [resource name] command has been added to the data dictionary. This command is only active for resources that contain data files. Select a resource in the data dictionary, on the New Item menu or from the context menu, call the New Data Source [resource name] command. After that, the New Data dialog will be called with a link to this resource.
Search for Items in Parameters
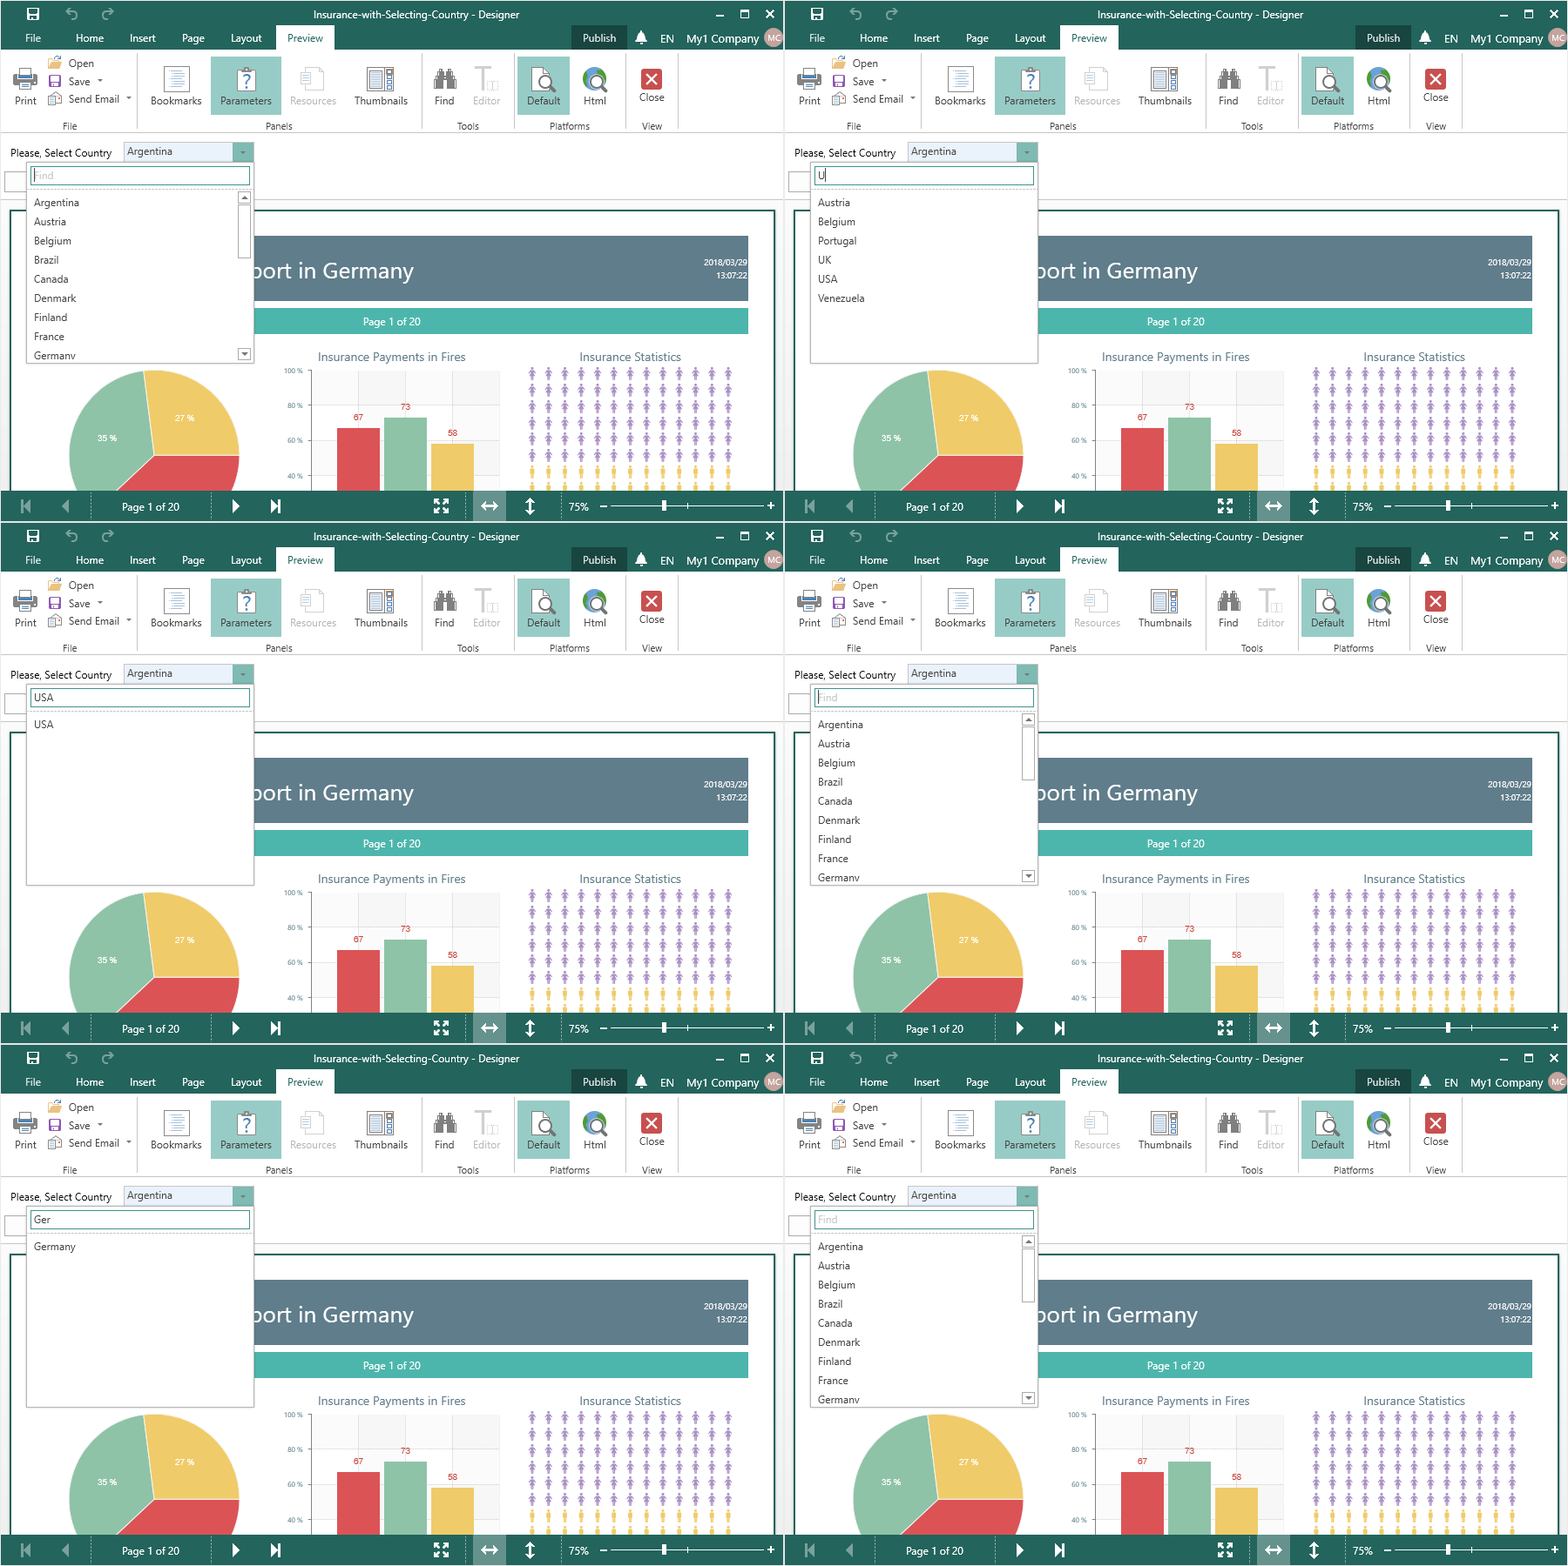
In the release 2018.2, the ability to find parameter values is added. If the number of parameter values is greater than 10, the search field will be displayed in the list of values. It is enough to enter a symbol, a part of a value or an entire value, and the list of parameter values will be filtered in real time.
New Files in Resources
Now you can attach PDF files as Word to the report. To do this, drag the files to the Dictionary of the report. Also, these files can be displayed in the resource panel in the viewer.
New Barcode Editor
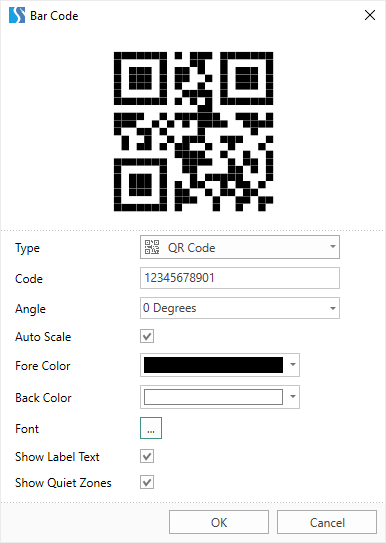
For the release 2018.2, we improved the editor of the Barcode component. The basic settings can be found in the barcode editor, and additional settings - in the property panel. Also there is a barcode preview bar in the editor.
New Shape Menu
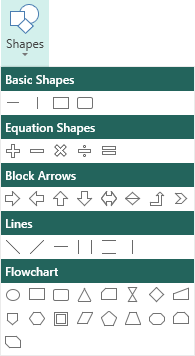
Beginning with the release of 2018.2 all primitives are grouped in one menu and split by the shape type. The Shapes menu is located in the Insert tab and on the Toolbox in the report designer.
New Page Button
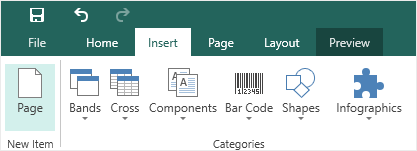
Previously, the command to add a new page to the report template, depending on the designer, was placed in various locations. Now, in order to add a new page to the report template, click the Page button on the Insert tab.
New Status Bar
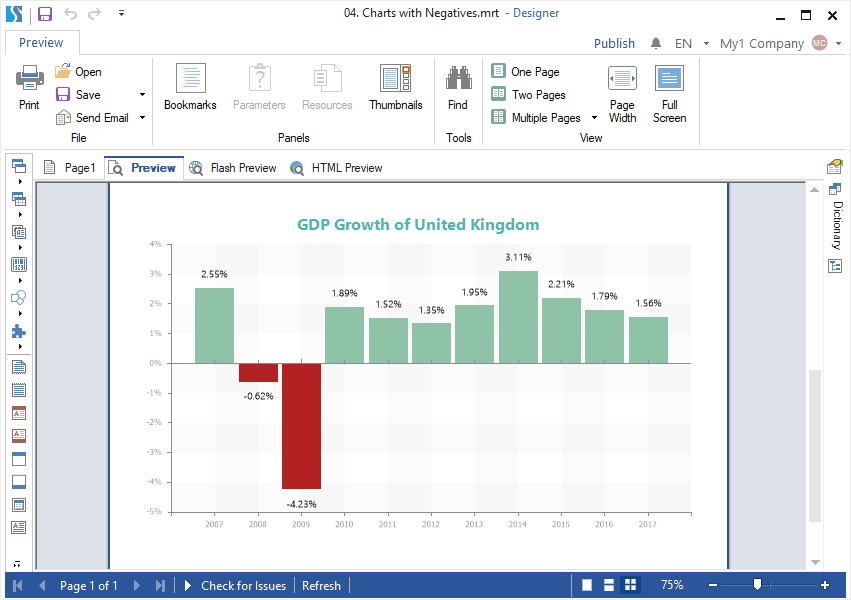
The WinForms designer now has the redesigned status panel for the preview and report designer. Earlier, there were two of them, now the panel is one, while full functionality is remained. Also, a visual element of the report rendering was added.
Resource Panel in Viewer
Now documents (PDF, Word, Excel, etc.) and images added to the report resources can be displayed in the viewer. To do this, select the checkbox for the Available in the Viewer option in the Edit Resource dialog or when creating it. After that, this resource will be displayed in a separate panel in the viewer window or in the preview tab. Also, it can be viewed or saved to a file in the viewer.

Custom Fonts in Reports
The release of 2018.2, we added the ability to use custom fonts in the report. To do this, drag the file with fonts (ttf, otf) to the Dictionary of the report. In the font collection, you will add custom fonts that you can apply to the text components of the report.

New Style Editor
We have completely redesigned the style editor. Collections and styles are now displayed in a hierarchical form. Use drag’and’drop to change the collection for the style. Also we added filters and sorting styles. In addition, all the styles used in the report are checked with markers in the style editor. Also, search of a style by name or part of name is added.

Refresh Time for Reports
Starting with release 2018.2, you can define the time interval after which the report will be rebuilt. In addition to the preset values, you can enter custom values in seconds.
Access to Reports
In the release 2018.2, you can configure remote access to the report preview from the report designer. To do this, select File -> Share. Save the report in Stimulsoft Cloud, set the access settings and view the report remotely by reference, by the barcode or embed the report code in your HTML page.

Sub-reports from Resources
Starting with the release 2018.2, you can add other reports (mrt, mrz, mdc, mdz) to the report as resources, and use these built-in reports in the Sub-Report component. To do this, in the Hyperlink tab in the editor of the sub-report, select a report from the resource gallery or specify a link to the resource manually.

Interactive Chart in Reports.JS
Starting with the release 2018.2, you can view reports with interactive data in the charts. Interactivity of data can be organized from a chart to a diagram, from a chart to other components of a report, from other report components to a chart. Interactivity of charts works in both the Web viewer component and in the preview tab in the report designer.

Text Files in Report Resources
You can add text files (txt, rtf) to the report resources, and then display them in the report using the RichText component. Add text files to the resources, then open the RichText component editor text and select a text file from the resource gallery.

Dragging Data to a Dictionary
When dragging a data file into the dictionary, there are various options for adding it. If the file is dragged to the top of the dictionary, a new data source will be created based on this file. If you drag the data file to the bottom of the dictionary, the data file will be added to the report resources.

Move to Resources Command
When creating file data sources, you can move them to report resources. To do this, click the Move to Resource button in the New Data window. After that, the data file will be added to the report resources, and the data source will be created based on this resource. In addition, for DBF and CSV data sources, you can specify the path to the repository with multiple CSV and DBF files. In this case, when you click the Move to Resources button, all CSV and DBF files from the specified repository will be added to the report.

Saving Resources
In the release 2018.2, the ability to save resources to a file is added. To do this, click the Save button in the Edit Resource window. The resource will be saved to a file of the same type that it was before the report was added.

New Command for Resources
The new New Data Source [resource name] command has been added to the data dictionary. This command is only active for resources that contain data files. Select a resource in the data dictionary, on the New Item menu or from the context menu, call the New Data Source [resource name] command. After that, the New Data dialog will be called with a link to this resource.

Search for Items in Parameters
In the release 2018.2, the ability to find parameter values is added. If the number of parameter values is greater than 10, the search field will be displayed in the list of values. It is enough to enter a symbol, a part of a value or an entire value, and the list of parameter values will be filtered in real time.

New Files in Resources
Now you can attach PDF files as Word to the report. To do this, drag the files to the Dictionary of the report. Also, these files can be displayed in the resource panel in the viewer.
New Barcode Editor
For the release 2018.2, we improved the editor of the Barcode component. The basic settings can be found in the barcode editor, and additional settings - in the property panel. Also there is a barcode preview bar in the editor.

New Shape Menu
Beginning with the release of 2018.2 all primitives are grouped in one menu and split by the shape type. The Shapes menu is located in the Insert tab and on the Toolbox in the report designer.

New Page Button
Previously, the command to add a new page to the report template, depending on the designer, was placed in various locations. Now, in order to add a new page to the report template, click the Page button on the Insert tab.

New Status Bar
The WinForms designer now has the redesigned status panel for the preview and report designer. Earlier, there were two of them, now the panel is one, while full functionality is remained. Also, a visual element of the report rendering was added.
