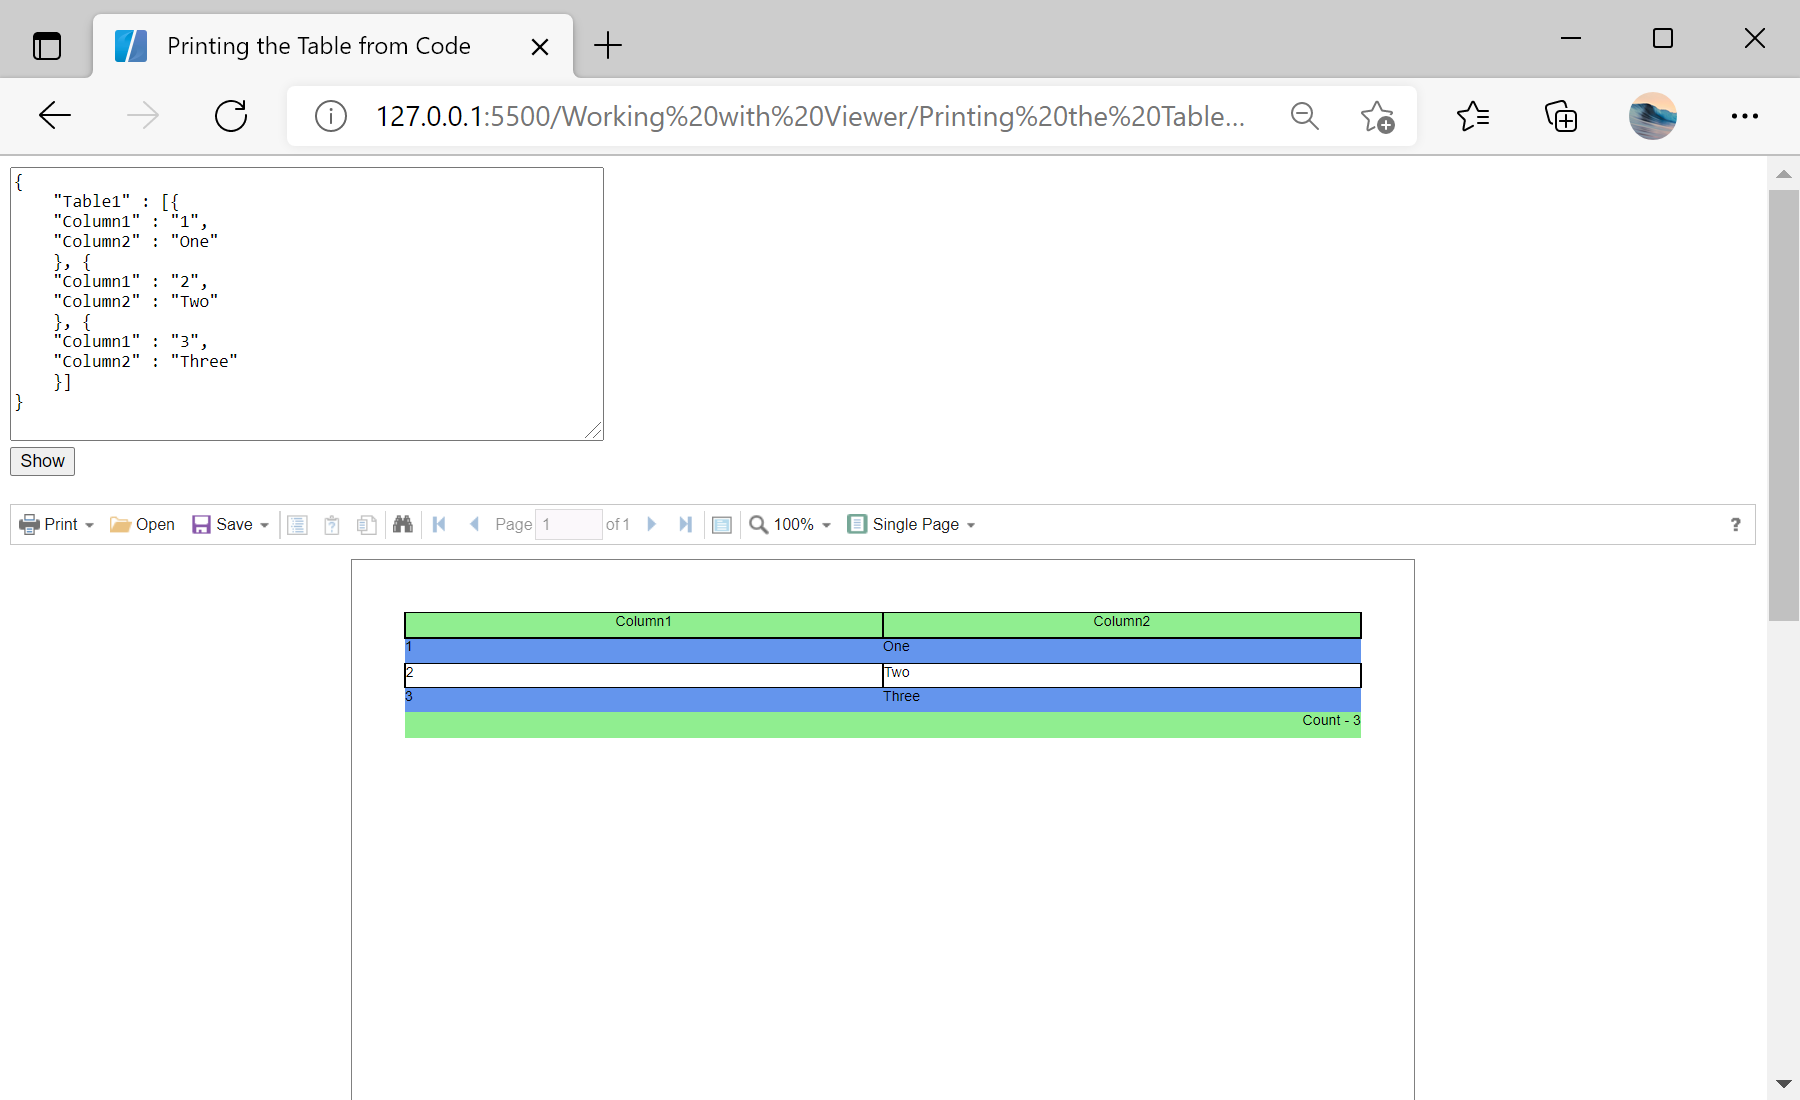
This example shows how to create and print data table from JavaScript code. As input, define a text area with JSON data and allow to change this data:
<textarea name="jsonString" id="jsonString" style="width: 440px; height: 200px;">
{
	"Table1" : [{
		"Column1" : "1",
		"Column2" : "One"
	}, {
		"Column1" : "2",
		"Column2" : "Two"
	}, {
		"Column1" : "3",
		"Column2" : "Three"
	}]
}
</textarea><br />
<input type="submit" value="Show" onclick="onShowClick()" />
On the button click event
onShowClick() create a report and all of its components with code. First, create a new report and prepare data for it:
function onShowClick() {
	var jsonData = JSON.parse(jsonString.value);

	var dataSet = new Stimulsoft.System.Data.DataSet();
	dataSet.readJson(jsonData);
	var data = dataSet.tables.getByIndex(0);

	var report = new Stimulsoft.Report.StiReport();

	// Add data to datastore
	report.regData("data", "data", dataSet);

	// Fill dictionary
	var dataSource = new Stimulsoft.Report.Dictionary.StiDataTableSource(data.tableName, data.tableName, data.tableName);
	dataSource.columns.add(new Stimulsoft.Report.Dictionary.StiDataColumn("Column1", "Column1", "Column1"));
	dataSource.columns.add(new Stimulsoft.Report.Dictionary.StiDataColumn("Column2", "Column2", "Column2"));
	report.dictionary.dataSources.add(dataSource);

...
Next, add a Header Band and Data Band to the report:
...

	var page = report.pages.getByIndex(0);

	// Create HeaderBand
	var headerBand = new Stimulsoft.Report.Components.StiHeaderBand();
	headerBand.height = 0.5;
	headerBand.name = "HeaderBand";
	page.components.add(headerBand);

	// Create Databand
	var dataBand = new Stimulsoft.Report.Components.StiDataBand();
	dataBand.dataSourceName = data.tableName;
	dataBand.height = 0.5;
	dataBand.name = "DataBand";
	page.components.add(dataBand);

...
Next, place Text Boxes with titles of data on the Header Band, and Text Boxes with reference to data source fields on the Data Band:
...

	// Create texts
	var pos = 0;
	var columnWidth = Stimulsoft.Base.StiAlignValue.alignToMinGrid(page.width / data.columns.count, 0.1, true);
	var nameIndex = 1;

	for (var index in data.columns.list) {
		var dataColumn = data.columns.list[index];
		// Create text on header
		var headerText = new Stimulsoft.Report.Components.StiText();
		headerText.clientRectangle = new Stimulsoft.Base.Drawing.RectangleD(pos, 0, columnWidth, 0.5);
		headerText.text = dataColumn.caption;
		headerText.horAlignment = Stimulsoft.Base.Drawing.StiTextHorAlignment.Center;
		headerText.name = "HeaderText" + nameIndex.toString();
		headerText.brush = new Stimulsoft.Base.Drawing.StiSolidBrush(Stimulsoft.System.Drawing.Color.lightGreen);
		headerText.border.side = Stimulsoft.Base.Drawing.StiBorderSides.All;
		headerBand.components.add(headerText);

		// Create text on Data Band
		var dataText = new Stimulsoft.Report.Components.StiText();
		dataText.clientRectangle = new Stimulsoft.Base.Drawing.RectangleD(pos, 0, columnWidth, 0.5);
		dataText.text = String.format("{{0}.{1}}", data.tableName, dataColumn.columnName);
		dataText.name = "DataText" + nameIndex.toString();
		dataText.border.side = Stimulsoft.Base.Drawing.StiBorderSides.All;

		// Add highlight
		var condition = new Stimulsoft.Report.Components.StiCondition();
		condition.backColor = Stimulsoft.System.Drawing.Color.cornflowerBlue;
		condition.textColor = Stimulsoft.System.Drawing.Color.black;
		condition.expression = "(Line & 1) == 1";
		condition.item = Stimulsoft.Report.Components.StiFilterItem.Expression;
		dataText.conditions.add(condition);

		dataBand.components.add(dataText);

		pos = pos + columnWidth;
		nameIndex++;
	}

...
Then, add the Footer Band with the Text Box to the report for showing the Total value:
...

	// Create FooterBand
	var footerBand = new Stimulsoft.Report.Components.StiFooterBand();
	footerBand.height = 0.5;
	footerBand.name = "FooterBand";
	page.components.add(footerBand);

	// Create text on footer
	var footerText = new Stimulsoft.Report.Components.StiText();
	footerText.clientRectangle = new Stimulsoft.Base.Drawing.RectangleD(0, 0, page.width, 0.5);
	footerText.text = "Count - {Count()}";
	footerText.horAlignment = Stimulsoft.Base.Drawing.StiTextHorAlignment.Right;
	footerText.name = "FooterText";
	footerText.brush = new Stimulsoft.Base.Drawing.StiSolidBrush(Stimulsoft.System.Drawing.Color.lightGreen);
	footerBand.components.add(footerText);

...
In the end, assign the report and show it in the viewer:
...

	viewer.report = report;
};
На скриншоте ниже Вы можете увидеть результат выполнения данного кода:


