We are happy to announce the immediate availability of the Stimulsoft Reports product line version 2012.2. Updates of the reporting tools is now available to download and adds several new features. Various new functions, properties, improved components, new tools, updated exporting and many other options are implemented in this release. Highlights include:
New Products Included
We have developed two new products which are solutions for mobile devices – Stimulsoft Reports.WinRT and Stimulsoft Reports.Mobile. Based on HTML5 (Stimulsoft Reports.Mobile) and WinRT (Stimulsoft Reports.WinRT) technologies the products are outstanding set of reporting components for developers who are involved in creating business applications for tablet PCs, smartphones and need to process and represent data at its best. Powerful suite of controls allows designing reports as complex as needed.
New Financial Charts
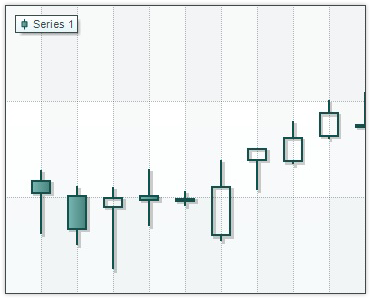
We have added three new types of financial charts in Stimulsoft Reports. The first is the Funnel chart. It is used to display the dynamics of reducing stocks. The second chart is Candlestick. This diagram is used to display financial information. The third chart is Stock that is used to display stock data.
New Silverlight Themes
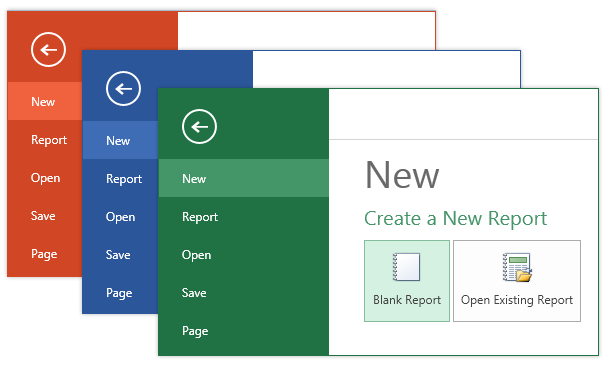
We have added new themes in the Silverlight version of our products. The following new themes are added Office 2013 Blue, Office 2013 Violet, Office 2013 Carmine, Office 2013 Teal, Office 2013 Green, Office 2013 Orange, Office 2013 and Office Light Blue 2013 Purple. New themes are available for all interface items of Silverlight version.
KeepDetails Property
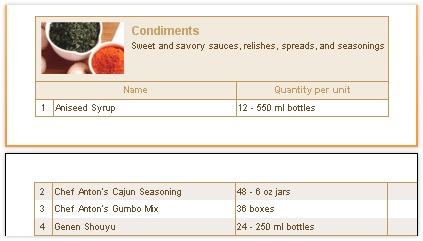
In the new version of our product we have extended functionality of the KeepDetailsTogether property of a data band. First, this property now is obsolete. Second, we have added the new property KeepDetails. It may have three values: None – old false value, KeepDetailsTogether – old true value, and KeepFirstDetail value. All reports will be converted automatically.
Encrypted Connection Strings
The new version of Stimulsoft Reports stores all connection strings in the report as encrypted ones. This improvement will solve the problem of unauthorized access to the database through the report contents. Reports created in previous versions, will be converted automatically.
New Videos
Large number of examples of new videos has been added in our website. We have tried to show in them technics which are very interesting and the most demanding ones. Videos highlight the problems that arise when developing reports. See all videos here.
Teradata Is Now Supported
To the list of supported database adapters, we added another one - Teradata adapter. The adapter is delivered with products of the Stimulsoft Reports product line or can be downloaded from our website here the Database packs section.

Design Report Button
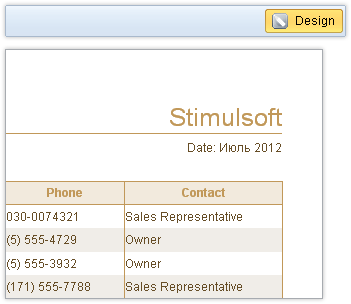
We have added a special button to the viewer toolbar to call the report designer directly from the report preview. By default the button is invisible, but you can enable it with help of the property of WebViewer. The OnReportDesign event of the WebViewer component will be called if a user clicks this button. The MvcViewer will call attached actions. You can call the Web Report Designer on Design Report button for example. We believe this button helps in improving usability of your application! The new button is available both for WebViewer, MvcViewer and for WebViewerFx components.
WCF in WPF
We are proud to say that we have added support for the WCF technology in our WPF Reports Viewer and WPF Reports Designer components. You can find a sample of WCF support realization in the Stimulsoft Reports installation pack.
New Samples
In order to simplify the learning curve of our products, we have added new project examples. New examples illustrate various aspects of working with reports.
Windows 8, VS2012 and .NET 4.5 Compatibility
Our team has tested all our products on Windows 8, Visual Studio 2012 and .NET 4.5. Problems they identified were eliminated. All of our components are ready to work in the new environment!
New Range Charts
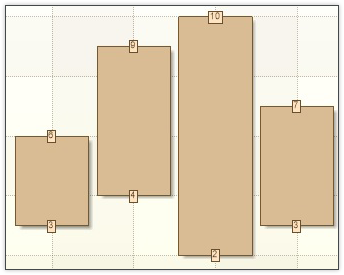
In the new version of Stimulsoft Reports we have added not only the financial charts, but two additional types of diagrams - RangeBar and Spline Range. They are used to show the difference between two series of values. The RangeBar chart shows the difference with step filling, Spline Range – filling with area.
New Function
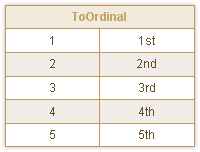
We have added the new function to the report dictionary – ToOrdinal.
New Importing Tool
New importing tool is added to the new release! Now you can convert your reports from ComponentOne reports. You can get this tool in our website in the download page the Tools section. This utility is also available in the installation packs of our products.
Accelerated WPF Viewer
We have spent much time to accelerate our WPF Reports Viewer. We are glad to say that we have made very fast visualization of report loading, report interaction, report rebuilding in the reports viewer. You can see this affect especially on big reports!
Trend Lines in Charts
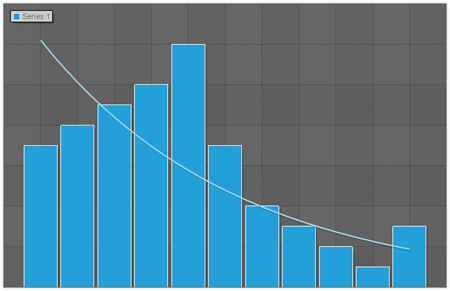
Trend Lines are used to show direction and price trend. Also it describes patterns during periods of price contraction. Now you can use Trend Lines in our chart component. The Trend Line is available as a property in the Series of the chart component. Our report engine supports three types of trend lines: Linear, Exponential, and Logarithmic.
WPF and .NET Framework 4
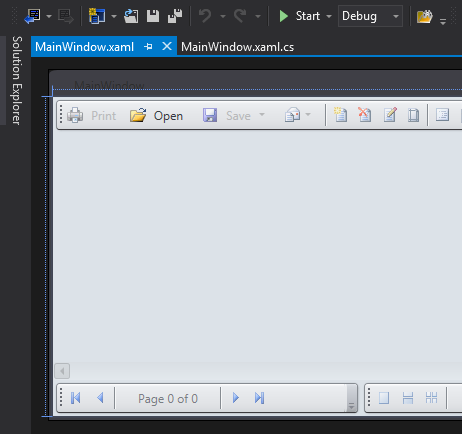
Starting with the version 2012.2 our WPF reporting components will be delivered for the .NET Framework 4-4.5. Changing the framework version allowed our team to increase the speed of our reports for WPF. We also expanded the printing option in WPF reporting tool. We also solved many problems that were not able to be fixed in the Framework version 3.5.
CheckBox and Styles
The CheckBox component of the report is supported now in the style collection. You can change all appearance of all components in the report with help of styles collection. Styles collection can be created and changed in Style Designer.
Locked Property in Silverlight
Locked property of the components is now supported in the Silverlight version of our Report Designer. You can lock component on the page with help of this property.
Printable Property in Silverlight
Printable property of the components is now supported in the Silverlight. You can skip printing components for this property is set to true.
New HTML Tags
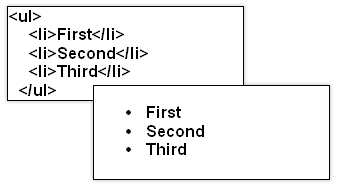
UL and OL html tags are now supported in the text component. You need to set the AllowHtmlTags property to true to enable drawing HTML tags. Using HTML tags, you can greatly improve readability, appearance, and sending information in the report. HTML tags allow building expressions to output information more flexibly.
New Component in Silverlight
The new component is supported in the report engine for Silverlight version 2012.2 – TextInCells. This component is able to display text in cells and can be used to print various types of document forms.

TopN in Charts
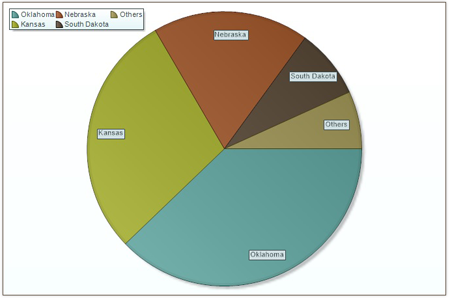
If the chart shows a lot of values then it is difficult to see the chart by a user. To solve this issue, we have added to the TopN property. Using this property, you can take some of the largest and smallest values in the chart, and other values are grouped into a single value. This feature simplifies the process of the user with the chart.
New Chart Style
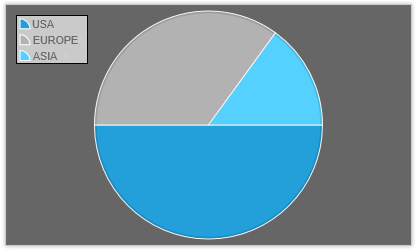
We have added a new chart style - Style 21.
New Products Included
We have developed two new products which are solutions for mobile devices – Stimulsoft Reports.WinRT and Stimulsoft Reports.Mobile. Based on HTML5 (Stimulsoft Reports.Mobile) and WinRT (Stimulsoft Reports.WinRT) technologies the products are outstanding set of reporting components for developers who are involved in creating business applications for tablet PCs, smartphones and need to process and represent data at its best. Powerful suite of controls allows designing reports as complex as needed.
New Financial Charts
We have added three new types of financial charts in Stimulsoft Reports. The first is the Funnel chart. It is used to display the dynamics of reducing stocks. The second chart is Candlestick. This diagram is used to display financial information. The third chart is Stock that is used to display stock data.

New Silverlight Themes
We have added new themes in the Silverlight version of our products. The following new themes are added Office 2013 Blue, Office 2013 Violet, Office 2013 Carmine, Office 2013 Teal, Office 2013 Green, Office 2013 Orange, Office 2013 and Office Light Blue 2013 Purple. New themes are available for all interface items of Silverlight version.

KeepDetails Property
In the new version of our product we have extended functionality of the KeepDetailsTogether property of a data band. First, this property now is obsolete. Second, we have added the new property KeepDetails. It may have three values: None – old false value, KeepDetailsTogether – old true value, and KeepFirstDetail value. All reports will be converted automatically.

Encrypted Connection Strings
The new version of Stimulsoft Reports stores all connection strings in the report as encrypted ones. This improvement will solve the problem of unauthorized access to the database through the report contents. Reports created in previous versions, will be converted automatically.
New Videos
Large number of examples of new videos has been added in our website. We have tried to show in them technics which are very interesting and the most demanding ones. Videos highlight the problems that arise when developing reports. See all videos here.
Teradata Is Now Supported
To the list of supported database adapters, we added another one - Teradata adapter. The adapter is delivered with products of the Stimulsoft Reports product line or can be downloaded from our website here the Database packs section.

Design Report Button
We have added a special button to the viewer toolbar to call the report designer directly from the report preview. By default the button is invisible, but you can enable it with help of the property of WebViewer. The OnReportDesign event of the WebViewer component will be called if a user clicks this button. The MvcViewer will call attached actions. You can call the Web Report Designer on Design Report button for example. We believe this button helps in improving usability of your application! The new button is available both for WebViewer, MvcViewer and for WebViewerFx components.

WCF in WPF
We are proud to say that we have added support for the WCF technology in our WPF Reports Viewer and WPF Reports Designer components. You can find a sample of WCF support realization in the Stimulsoft Reports installation pack.
New Samples
In order to simplify the learning curve of our products, we have added new project examples. New examples illustrate various aspects of working with reports.
Windows 8, VS2012 and .NET 4.5 Compatibility
Our team has tested all our products on Windows 8, Visual Studio 2012 and .NET 4.5. Problems they identified were eliminated. All of our components are ready to work in the new environment!

New Range Charts
In the new version of Stimulsoft Reports we have added not only the financial charts, but two additional types of diagrams - RangeBar and Spline Range. They are used to show the difference between two series of values. The RangeBar chart shows the difference with step filling, Spline Range – filling with area.

New Function
We have added the new function to the report dictionary – ToOrdinal.

New Importing Tool
New importing tool is added to the new release! Now you can convert your reports from ComponentOne reports. You can get this tool in our website in the download page the Tools section. This utility is also available in the installation packs of our products.
Accelerated WPF Viewer
We have spent much time to accelerate our WPF Reports Viewer. We are glad to say that we have made very fast visualization of report loading, report interaction, report rebuilding in the reports viewer. You can see this affect especially on big reports!
Trend Lines in Charts
Trend Lines are used to show direction and price trend. Also it describes patterns during periods of price contraction. Now you can use Trend Lines in our chart component. The Trend Line is available as a property in the Series of the chart component. Our report engine supports three types of trend lines: Linear, Exponential, and Logarithmic.

WPF and .NET Framework 4
Starting with the version 2012.2 our WPF reporting components will be delivered for the .NET Framework 4-4.5. Changing the framework version allowed our team to increase the speed of our reports for WPF. We also expanded the printing option in WPF reporting tool. We also solved many problems that were not able to be fixed in the Framework version 3.5.
CheckBox and Styles
The CheckBox component of the report is supported now in the style collection. You can change all appearance of all components in the report with help of styles collection. Styles collection can be created and changed in Style Designer.
Locked Property in Silverlight
Locked property of the components is now supported in the Silverlight version of our Report Designer. You can lock component on the page with help of this property.
Printable Property in Silverlight
Printable property of the components is now supported in the Silverlight. You can skip printing components for this property is set to true.
New HTML Tags
UL and OL html tags are now supported in the text component. You need to set the AllowHtmlTags property to true to enable drawing HTML tags. Using HTML tags, you can greatly improve readability, appearance, and sending information in the report. HTML tags allow building expressions to output information more flexibly.

New Component in Silverlight
The new component is supported in the report engine for Silverlight version 2012.2 – TextInCells. This component is able to display text in cells and can be used to print various types of document forms.

TopN in Charts
If the chart shows a lot of values then it is difficult to see the chart by a user. To solve this issue, we have added to the TopN property. Using this property, you can take some of the largest and smallest values in the chart, and other values are grouped into a single value. This feature simplifies the process of the user with the chart.

New Chart Style
We have added a new chart style - Style 21.


