We are pleased to announce the release of Stimulsoft 2025.2, the latest version of our software for creating reports, dashboards, and PDF forms! This update brings numerous improvements and enhancements for an even more easy data experience, including updated components for React, Vue.js, and Angular, expanded capabilities for Python and PHP applications, a new Macro PDF417 barcode type, Blockly functionality in Reports.JAVA, and much more.
A list of the new features in version 2025.2
- SQL encryption for PHP, Python
- Advanced Border editor in Web Designer
- Expressions in Sub-Report
- Expressions for the URL field in the Image dashboard element
- Expressions in Web Content in dashboards
- New method for registering fonts from JSON
- Registering data in PHP and Python
- Disabling shadows of titles in maps
- Interaction for the Progress element

New versions of components for React, Vue.js, Angular
In version 2025.2, we have updated and introduced new embedded components - a viewer and a report designer - for React, Vue.js, and Angular projects. Each component supports the following properties: report - a report or dashboard; options - component configuration options.Additionally, we have added several new events to enhance interaction with the components. The updated viewer and designer to be compatible with the standards and requirements of the React, Vue.js, and Angular frameworks. Embedded components can be activated with a subscription to Reports.JS, Dashboards.JS, or Stimulsoft Ultimate.

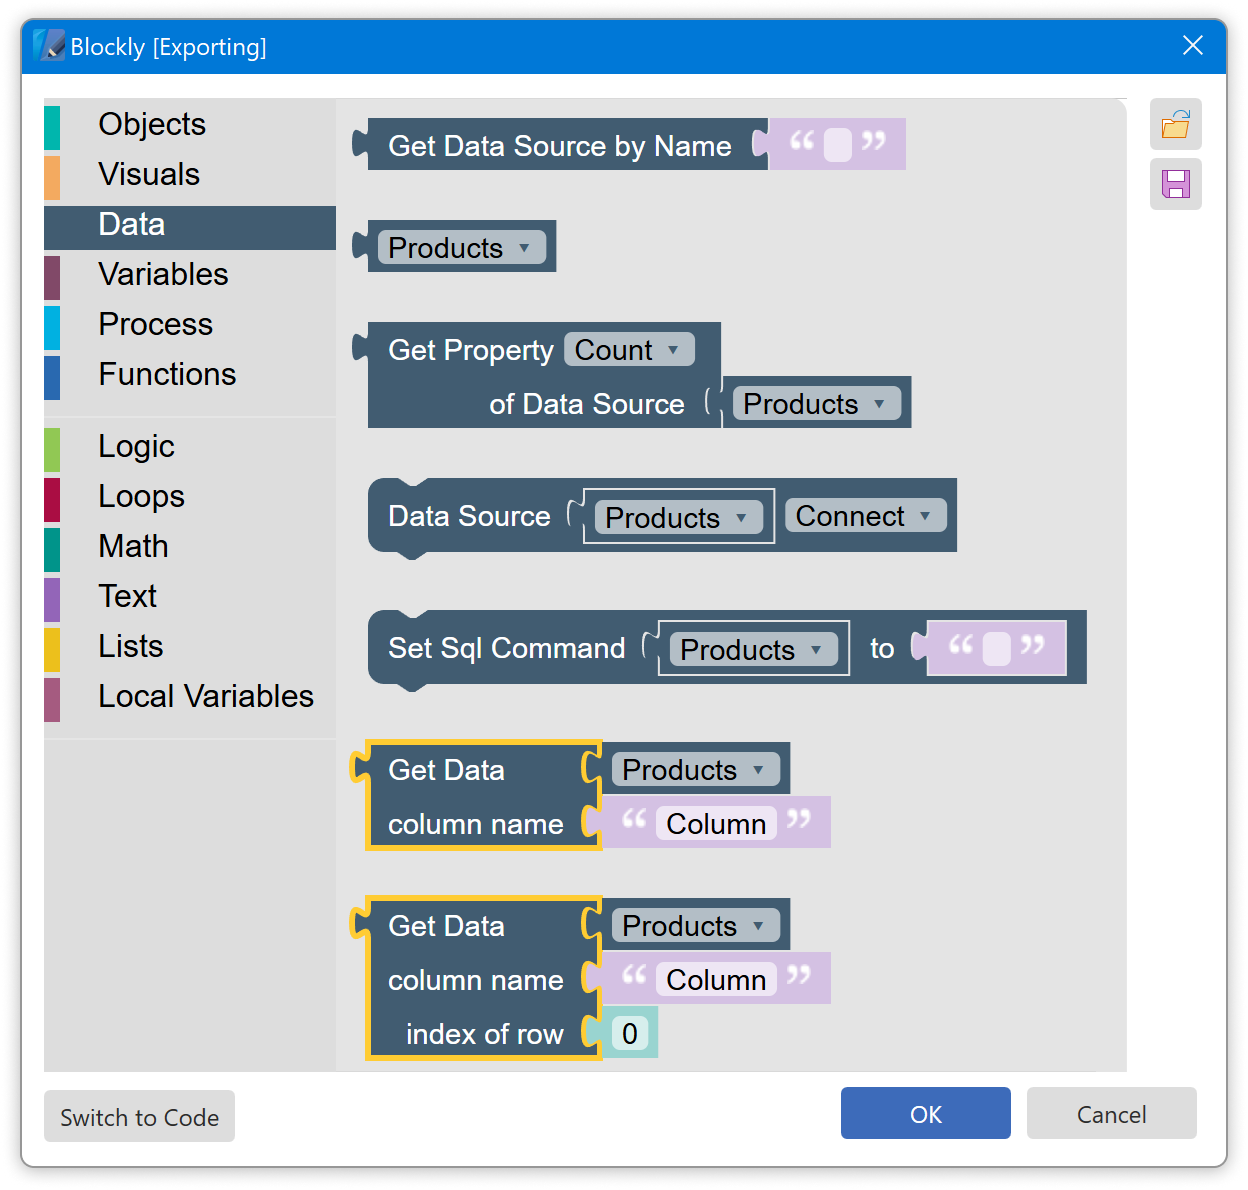
Blockly for Reports.JAVA
The Java reporting tool now supports Blockly for creating event scripts in reports. With Blockly, you can visually design scripts without writing any code. Scripts created using Blockly are universal across all our report engines, allowing reports to work on any platform.Barcode Macro PDF417
We have added a new barcode type - Macro PDF417 - which is available when designing reports. This barcode is based on the standard PDF417 barcode and inherits all its features. While a standard PDF417 barcode can store a limited amount of information (up to 2,710 characters), Macro PDF417 allows large data files to be split into blocks and encoded using individual Macro PDF417 symbols.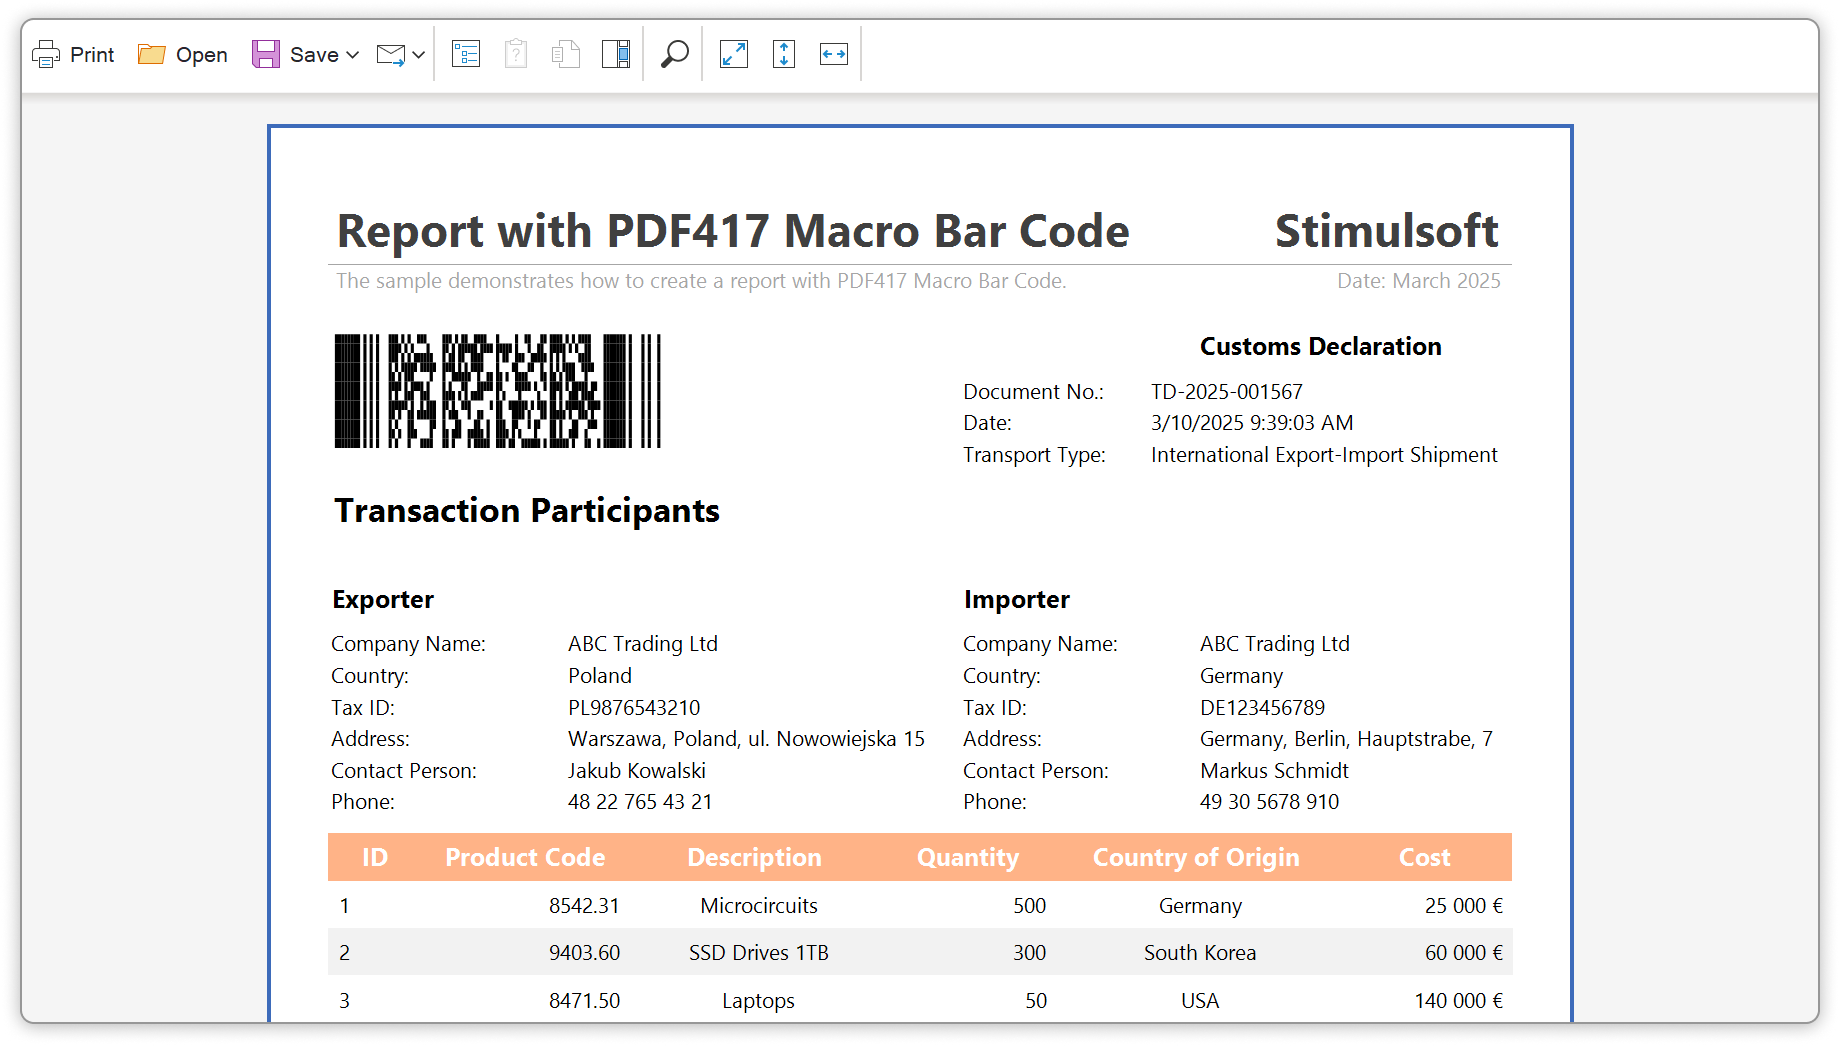
Filtering values in a variable
In version 2025.2.1, we have added the ability to filter variable values in the parameters panel of the viewer. This can be done in the variable editor, in the Items window, using the Filter field. Enter an expression in this field to filter the variable values. When viewing the report, the parameters panel will display only the filtered values.Updated expression editor
This release includes updates to the expression, text, and text component editors, along with the addition of expression samples. In addition, in Stimulsoft BI Designer, if the calculation mode property of a report is set to Interpretation, the automatic mode will be enabled for the text component editor. This means that expressions will be calculated as you type, with the results displayed in the panel below.New functions in the dictionary
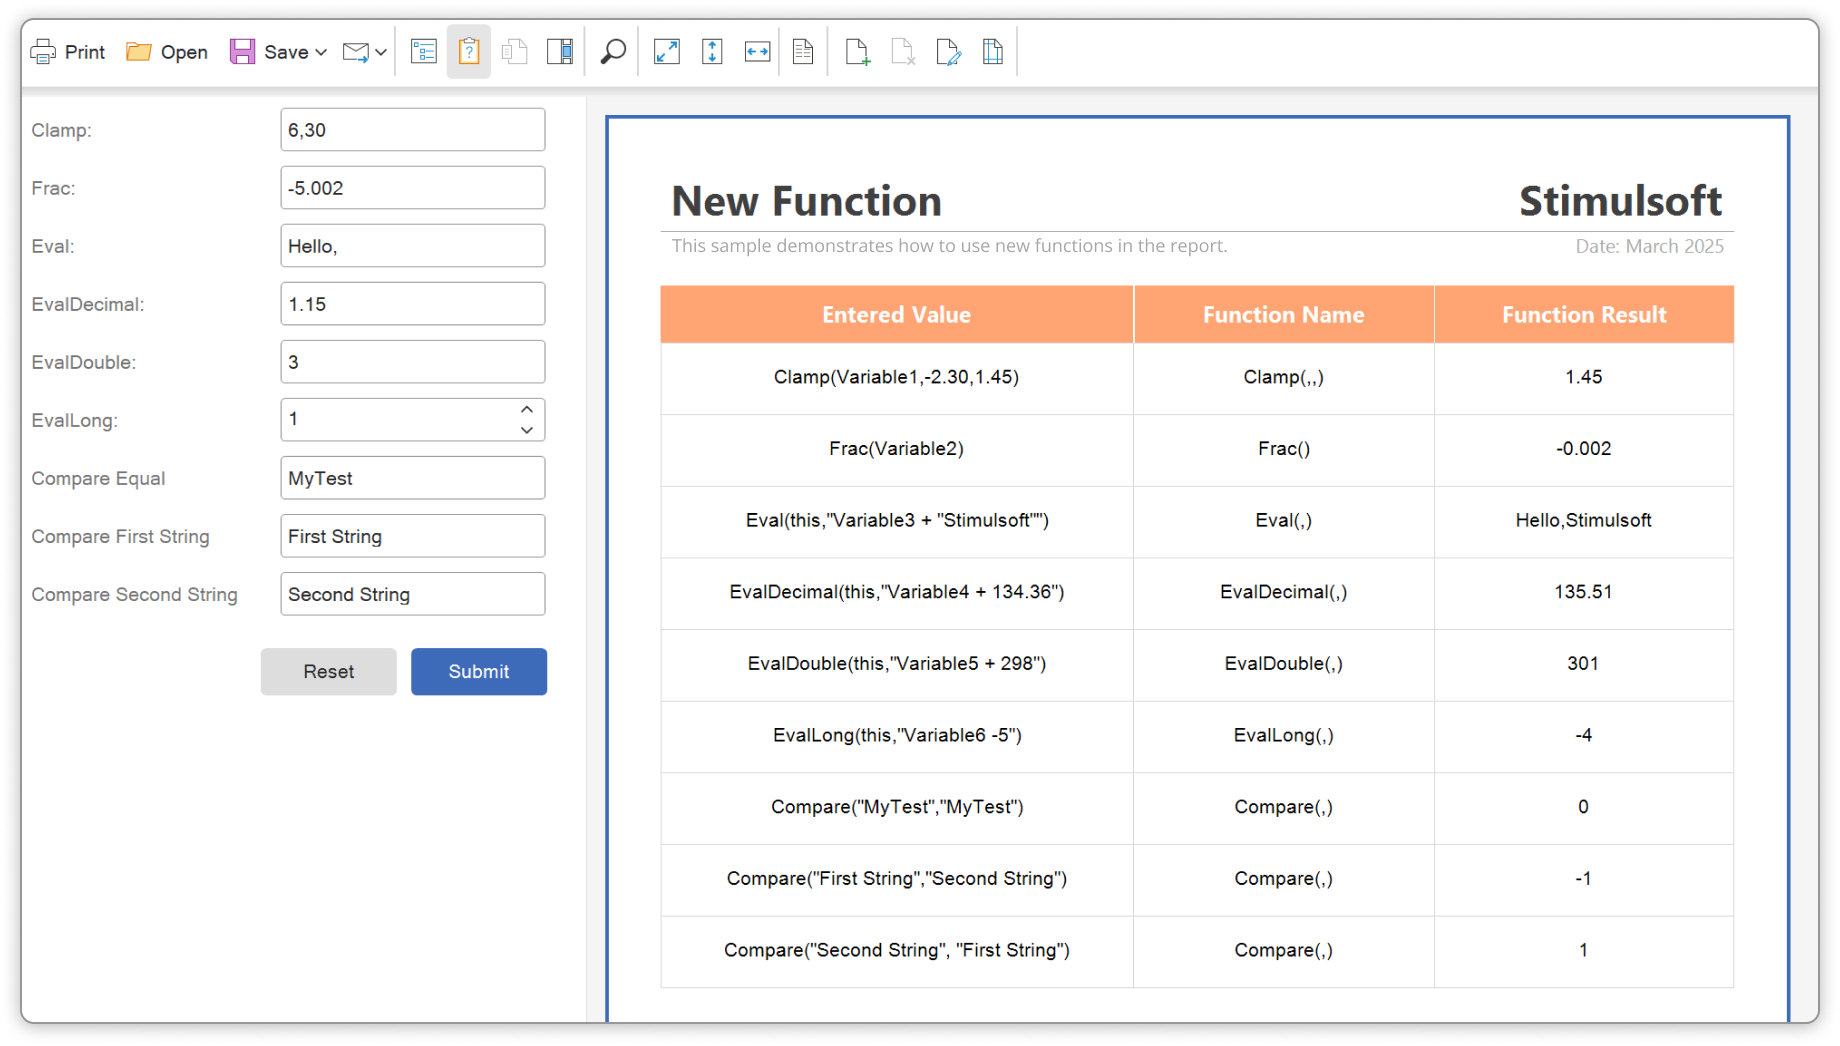
In release 2025.2.1, we have introduced new functions that can be used in reports and dashboards:- Clamp() - restricts a value within a specified range. If the value is within the range, it is returned as is; otherwise, the nearest boundary (upper or lower) is returned.
- Frac() - returns the fractional part of the given argument.
- Eval() - evaluates an expression within the context of a report and returns the result.
- Compare() - compares two string values and returns the result as a number.
Expressions in Gauge range fields
You can now specify expressions in the Gauge dashboard element when the range mode is set to custom. The expression will calculate the minimum or maximum bounds of the range. Please note that expressions are not supported when the Gauge is set to DateTime Mode.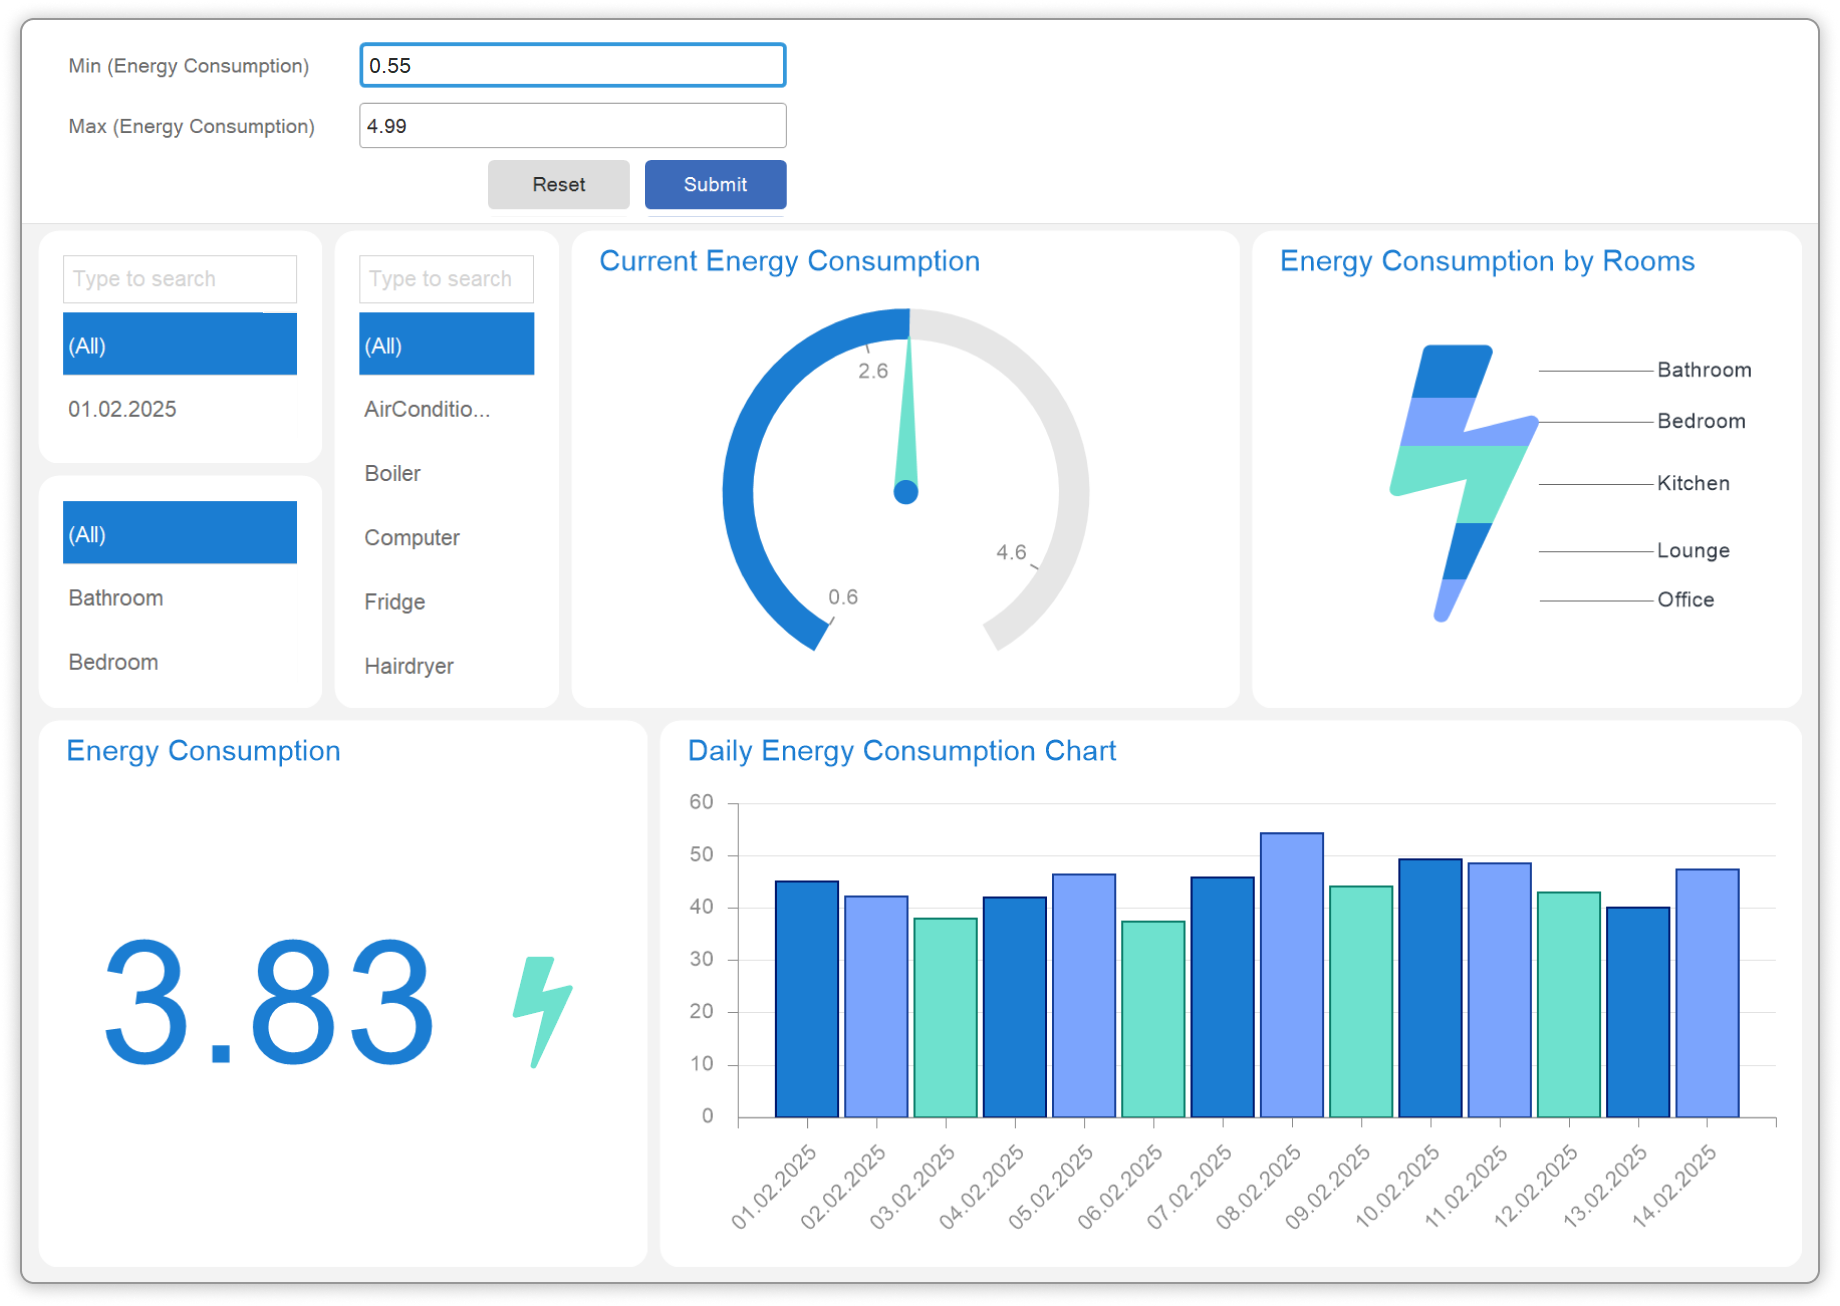

XML, JSON, CSV on the server-side for PHP and Python
In previous versions of the products for Python and PHP applications, only SQL data sources were controlled on the server-side.The new version introduces the ability to manage XML, JSON, and CSV file data sources on the server-side. You can now check the path to the data, download data, modify already downloaded data, and transfer it to the client-side reporting tool.

SQL encryption for PHP, Python
By default, all requests and responses are encrypted to ensure security. In previous versions of the PHP and Python products, you could disable encryption using the encryptData option, but only for all requests and responses at once.The new 2025.2 version introduces the encryptSqlData option, which allows you to disable encryption only for the response from the SQL source that transmits an array of already prepared data. This helps speed up the reporting tool when handling large amounts of data, without significantly affecting security.
Advanced Border editor in Web Designer
In release 2025.2.1, advanced border customization has been added for components in report design and editing within the web designer. Now, each border can be customized in terms of style, size, and color. Customization is done through the border editor on the Advanced tab.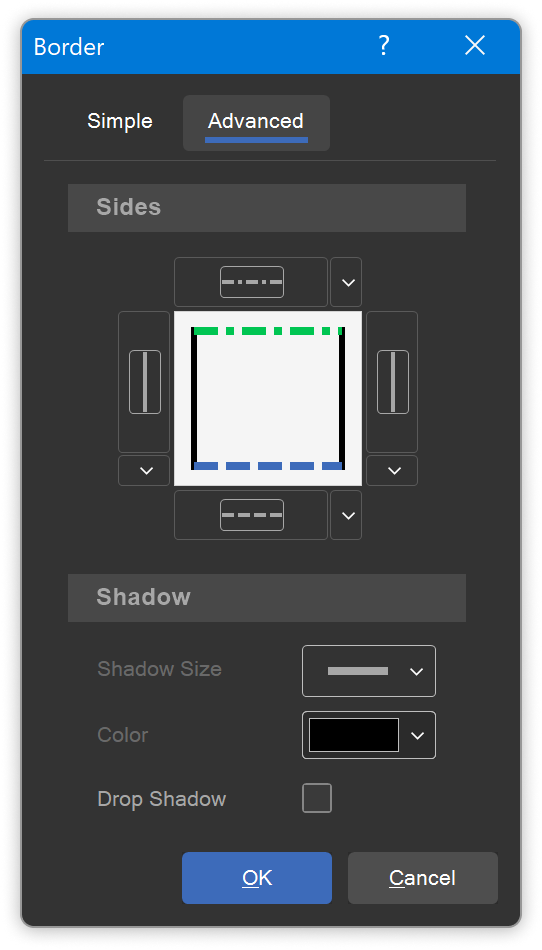
Expressions in Sub-Report
We have added support for expressions in the URL and File fields of the Sub-Report component. The result of calculating the expression will determine the URL or the path to the sub-report file.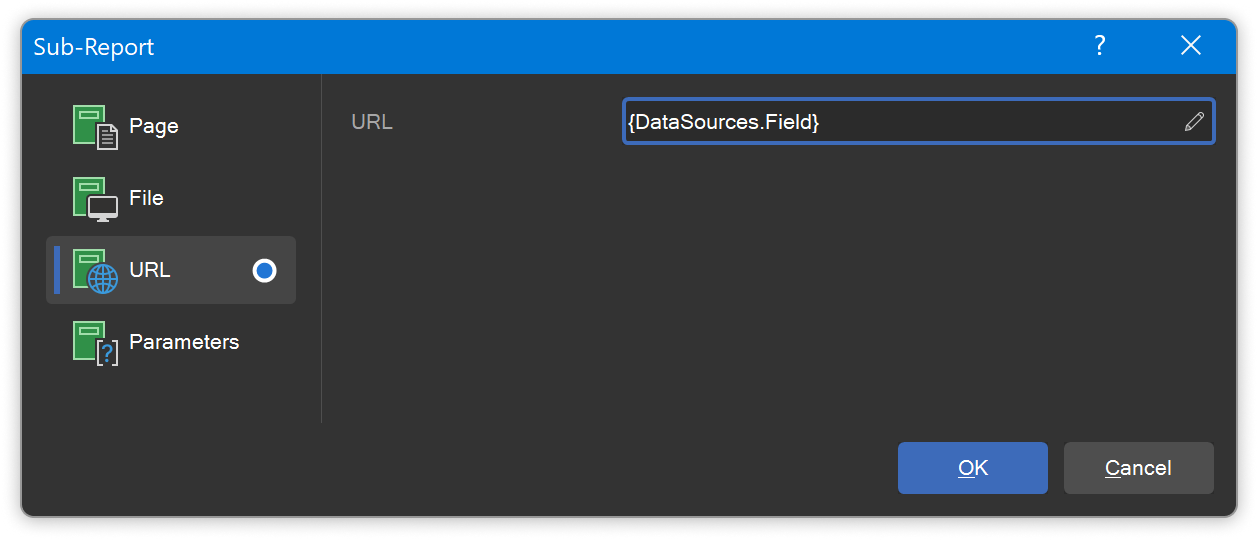
Expressions for the URL field in the Image dashboard element
In previous versions of our products, you could specify an expression in the URL field of the Image dashboard element in the format variable://variablename or dataColumn://field etc. Now, you can also specify the expression in curly brackets, for example, https://www.{DataSource.Field}.com or {myexpression}. The result of evaluating the expression can be either a string value or a byte array for an image.Expressions in Web Content in dashboards
For the Web Content dashboard element, support for expressions has been added to the URL field. The result of the expression will be the URL address of the resource. This allows you to specify a data column containing a list of URL addresses as an expression. When selecting a value, for example, in a filter, a specific resource will be loaded in the Web Content element while viewing the dashboard.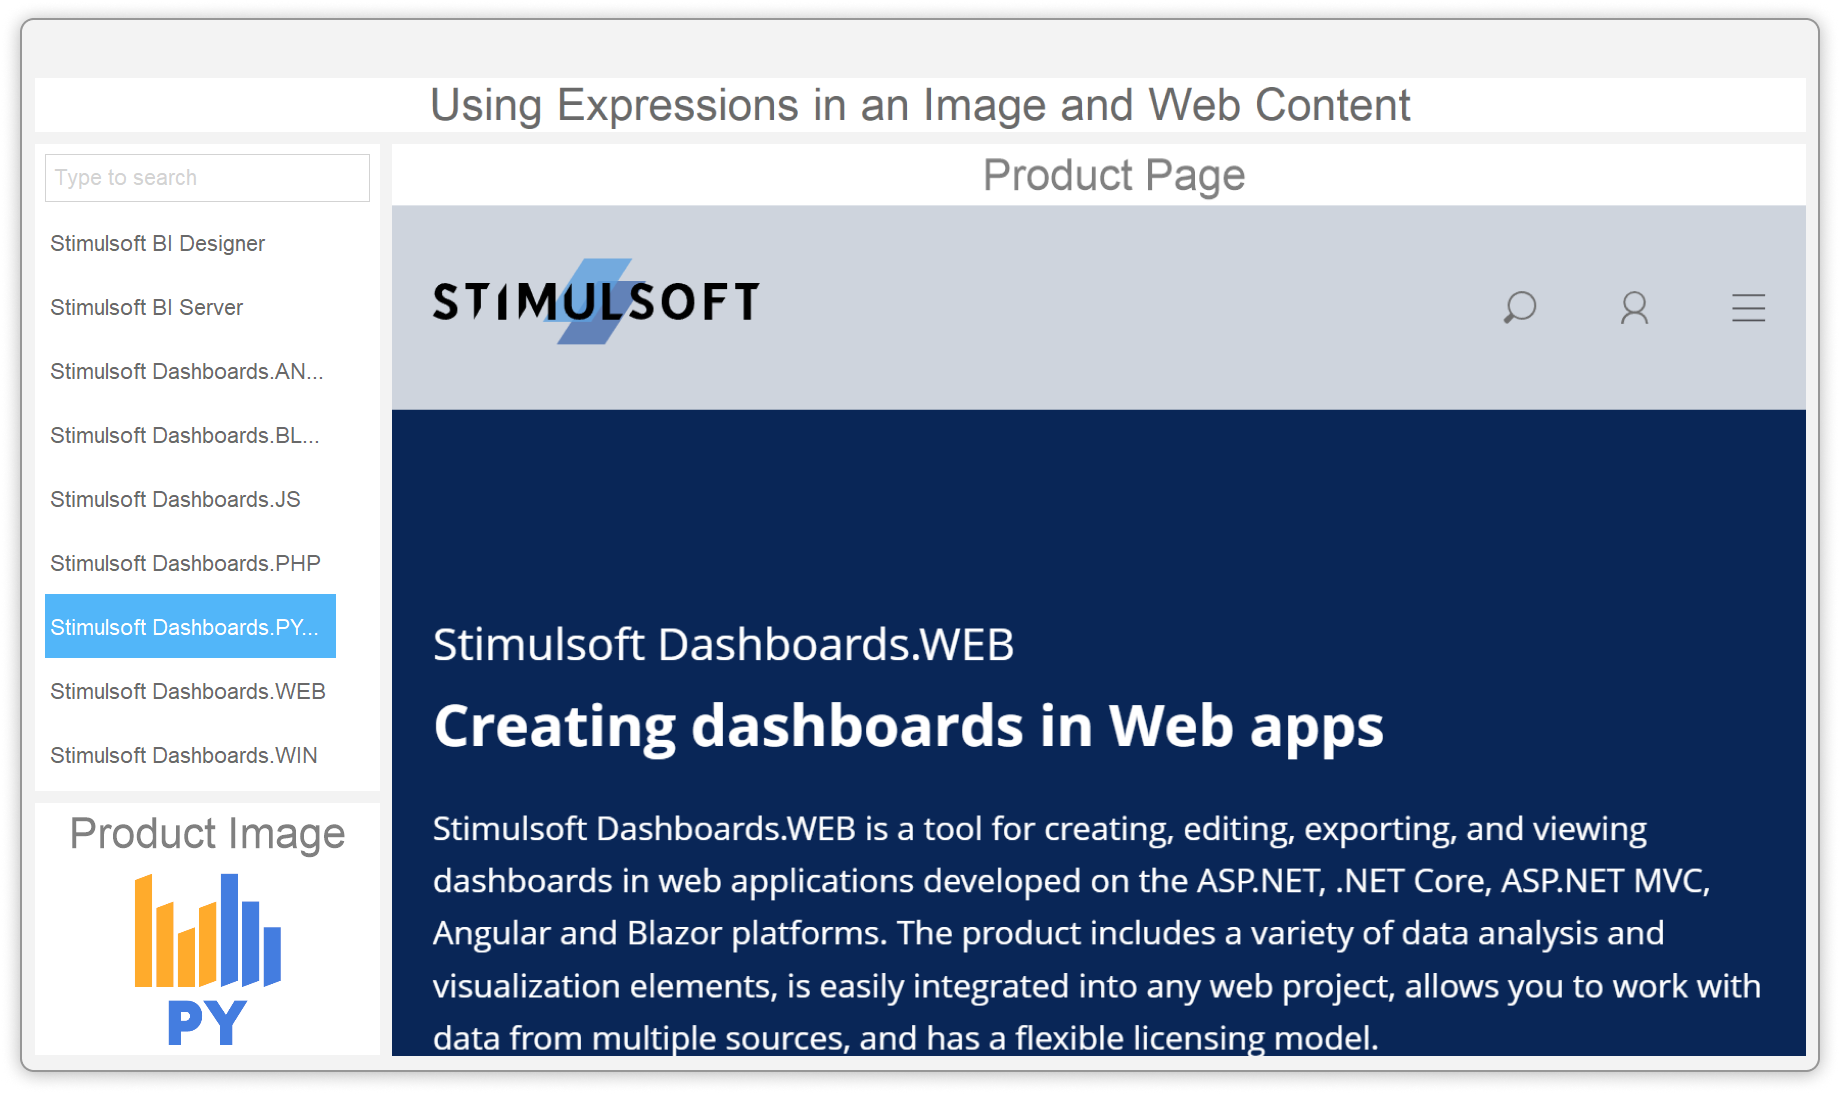

New method for registering fonts from JSON
A new method for adding fonts, registerFontConfig(), has been added to our JavaScript reporting software. This method allows you to load fonts from a configuration file.For web components, you cannot specify a folder containing fonts, but you can provide a configuration file that includes the font path, name, and style. All specified fonts will be loaded into the JS component.

Registering data in PHP and Python
We have added the ability to register data in a report using PHP and Python code. The data can be in the form of XML or JSON strings, as well as native objects or collections for both PHP and Python.The data can be registered either in the report object itself using the regData() method or in the onBeforeRender event, which can now be processed on the server-side.
Disabling shadows of titles in maps
For the Region Map element in dashboards and the Map component in reports, the ability to enable or disable the title shadow has been added. You can do this using the Show Shadow property within the Labels property group.Interaction for the Progress element
Support for interactive actions has been added for the Progress dashboard element: Show Tooltip, Show Hyperlink, Show Dashboard, Open Hyperlink. The settings are made in the element interaction editor.