We are pleased to announce the release of Stimulsoft Reports, Dashboards, and PDF Forms 2024.4, featuring valuable innovations and improvements. This release introduces new export options, a data adapter, an AI assistant, and more. Additionally, we are unveiling a major update for our Reports.PHP and Dashboards.PHP products (you can learn more about these updates in this article). The key innovations of version 2024.4 are outlined below.


A list of the new features in version 2024.4
- The <img> tag support
- Appearance for Table and Pivot Table
- The new style in dashboards
- The Scale Mode when exporting dashboards
- Interactions in Cards and Gauge elements
- Expanding and collapsing in Pivot Table
- User functions in the events
- Measures in the Text element
- Column size for the Table element
- View Name as Chart Title
- Constant Lines and Strips for 3D Charts
- Support ClickHouse adapter
Server-side rendering in PHP products for reports and dashboards
The latest version introduces server-side rendering for building and exporting reports directly on the PHP server. This update supports all report engine events and PHP data adapters. Reports are generated using the Node.js platform, and users can install the required modules either manually or automatically. Export settings WIN & WEB
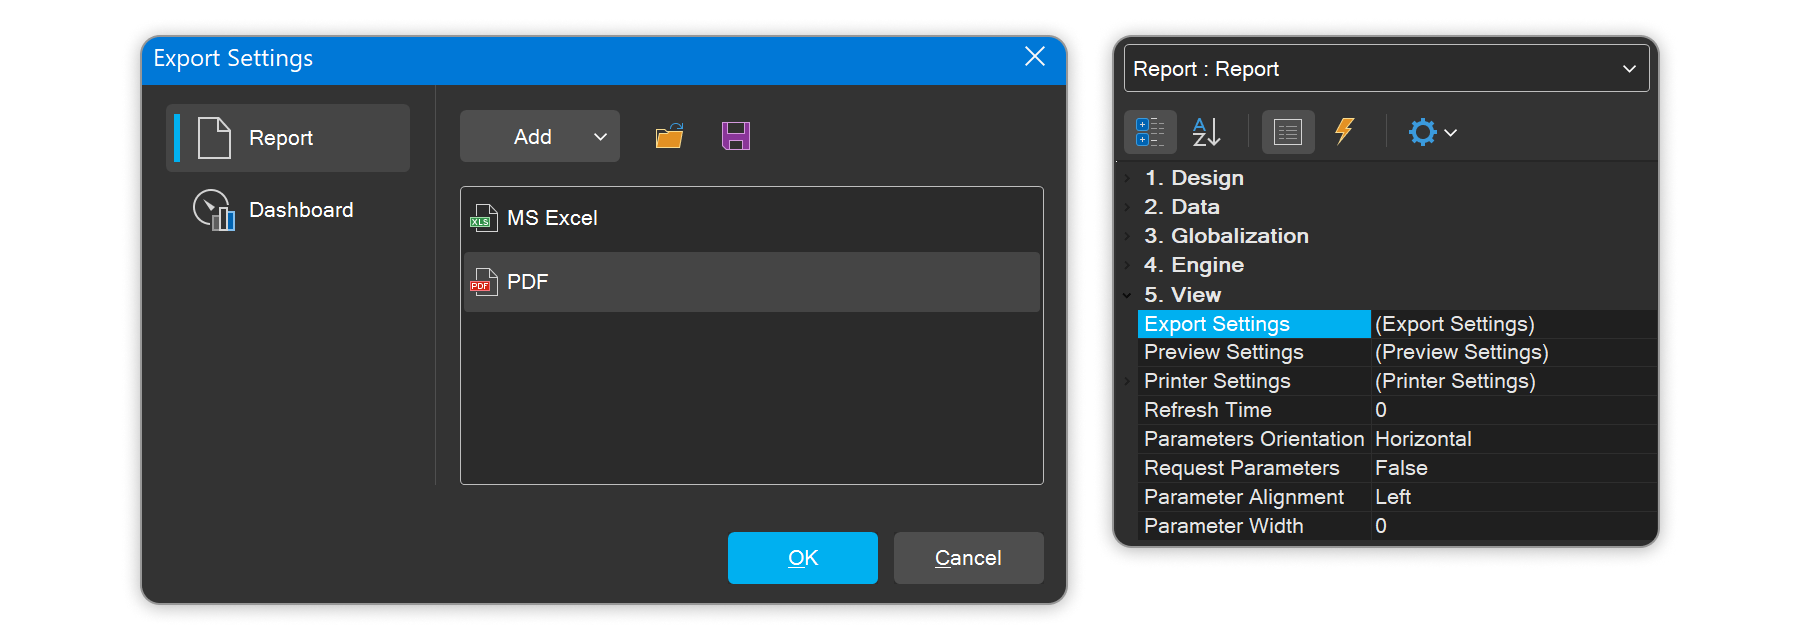
Starting with version 2024.4, you can now configure export settings directly within a report template using the new Export Settings property. This allows you to set up exports through the editor by selecting an export type and adjusting its settings via the properties panel. All export settings are saved within the template file. Improved event handler in PHP products
In version 2024.4, managing event handlers has become much simpler. There is no longer a need to create a separate event handler or configure events in a separate file. The event handler is now integrated directly into the components. You can simply add a PHP or JavaScript function to the desired event, and it will automatically trigger when the event occurs.AI work experience BI Designer for Windows & Cloud
In the 2024.4.1 release of Stimulsoft BI Designer, we have integrated the Stimul AI assistant to enhance the functionality of SQL data sources. Stimul AI assists with validating connection strings, as well as optimizing, generating, and verifying queries. Additionally, Stimul AI is now integrated into event and custom function editors. Beyond this, it is used for expression validation across various editors, such as the text component editor, Data Band, and conditional formatting editors.PHP export settings
We have added dedicated PHP classes for all export settings. Now, when exporting a report or dashboard, you can set all options supported for the selected format. These classes are also fully supported in PHP server-side export events.New JSON parser
In release 2024.4.1, we replaced jsonConverter V2, which was based on Newtonsoft.Json, with json V3, leveraging the advancements of the Utf8Json library. The new handler operates with zero memory allocation, reading and writing directly to UTF-8 binary code to boost performance. As a result, JSON object serialization speed has increased by 4 times, and deserialization speed by 6 times.Enhanced PHP components usability
We have optimized the functions for working with components, making it much easier to display or edit a report with significantly less code. The code is now simpler and more intuitive. Additionally, we have added support for various component display modes, including a simplified mode that does not require using HTML code.Search in Designer
A search bar has been added to Stimulsoft BI Designer, allowing users to easily access Stimulsoft resources, including documentation, blog posts, samples, the YouTube channel, and GitHub.Highlight сondition (TopN)
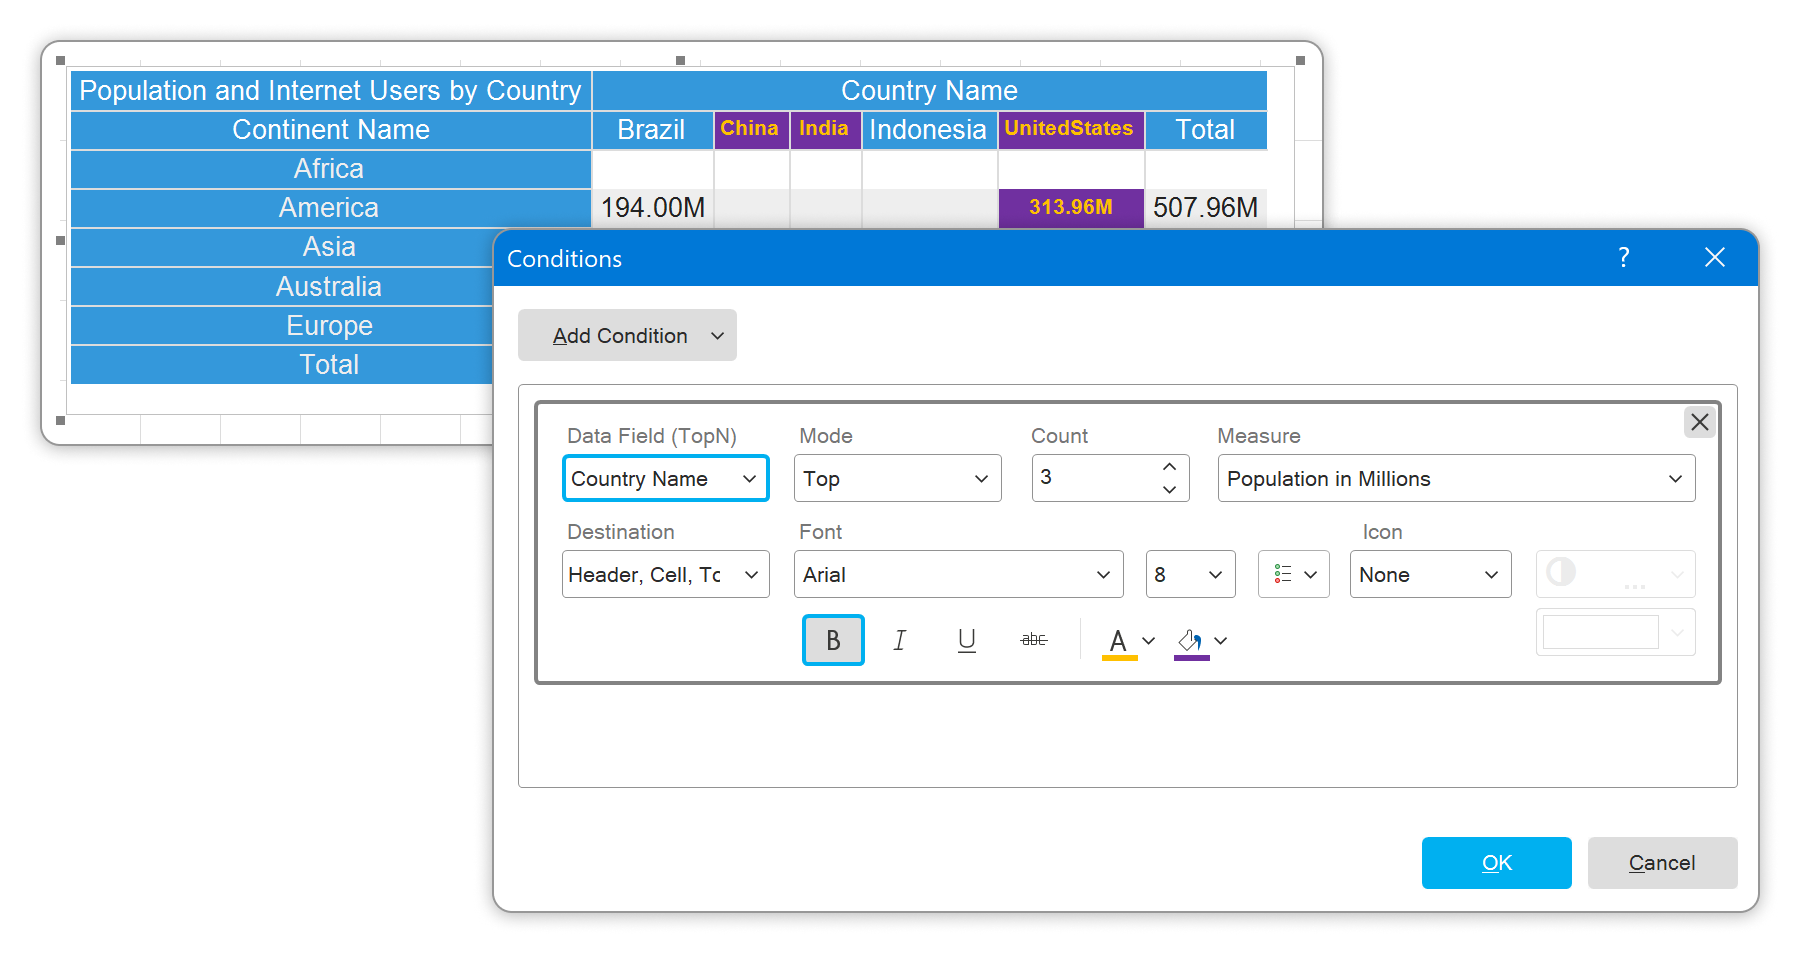
The Pivot Table dashboard element now includes the ability to conditionally format top values. You can specify whether to focus on maximum or minimum values and determine the number of top values to be formatted. This allows for changes in text or background color, font styles, and the addition of icons for emphasis. These settings can be configured in the Conditions editor by selecting a special type - TopN. TopN for Table and Cards elements WIN
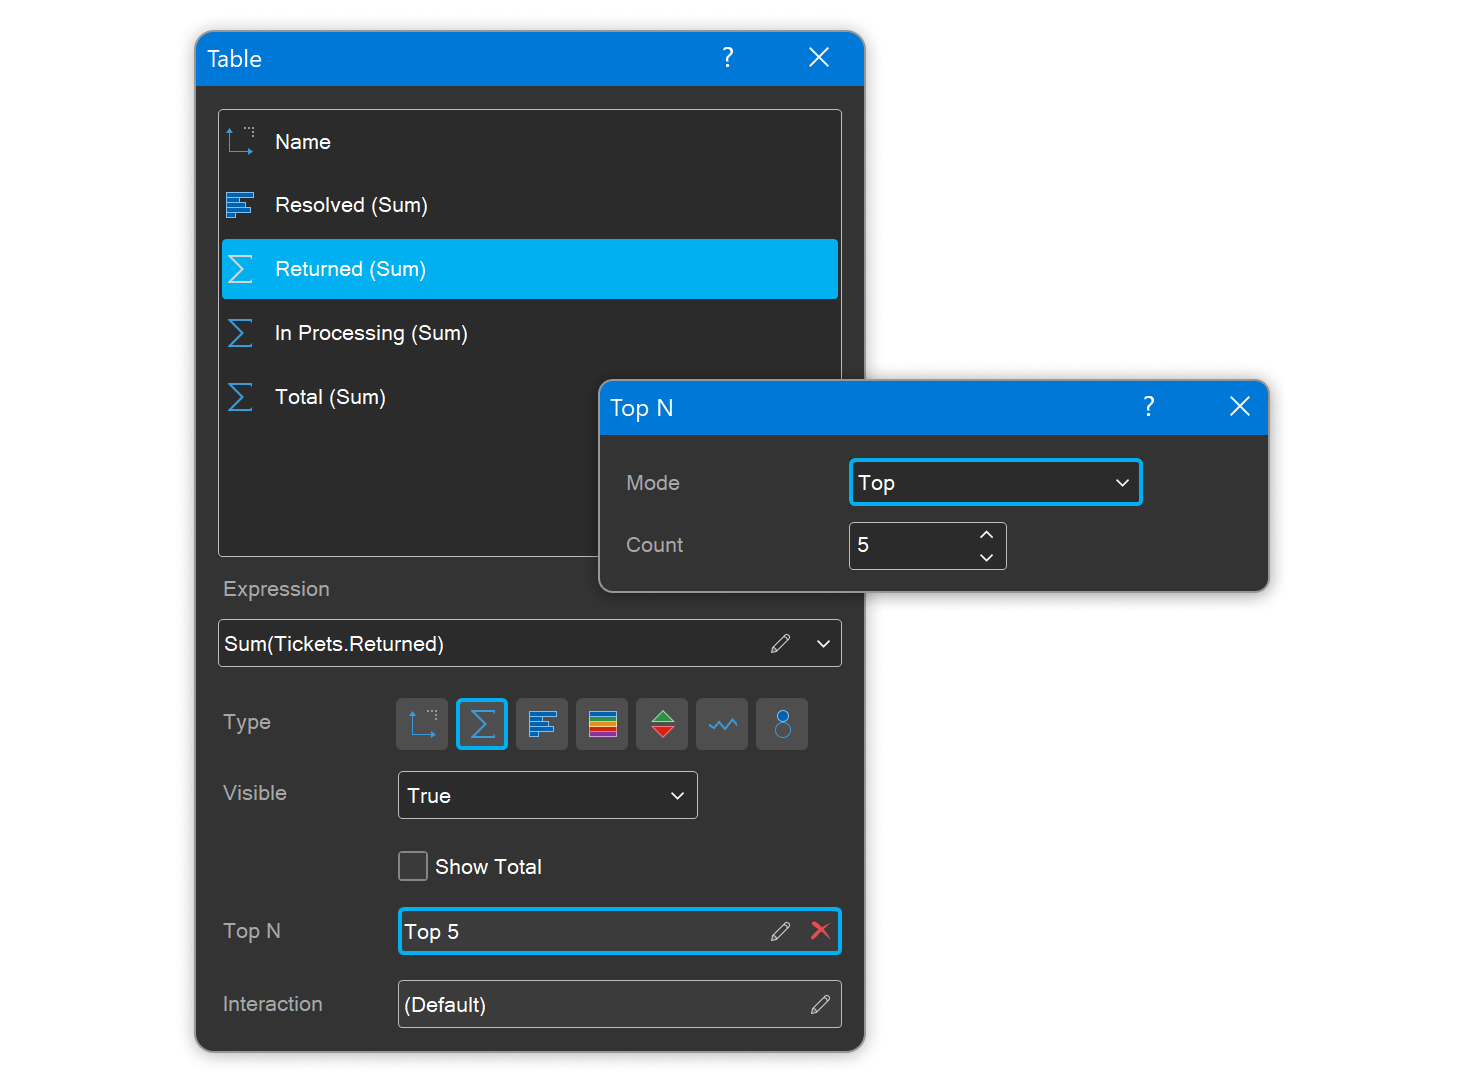
The ability to display the best values has been added for Measure fields in the Table and Cards dashboard elements. In the dashboard element editor, simply select the Measure field and access the editor for the TopN parameter. From there, you can specify the number of best values to display and choose the mode—either top (maximum) or bottom (minimum). 3D maps
Starting with release 2024.4.1, we have introduced support for 3D dimensioning in certain maps for the Map component in reports and the Region Map in dashboards. This 3D mode can be easily enabled or disabled in the component editor or by using the Show 3D property. Additionally, over 50 different maps have been added specifically for the Africa region.The <img> tag support .NET Engine
Release 2024.4 introduces support for the <img> HTML tag in reports, enabling the display of images within a text component. The primary attributes of this tag are also supported, including src, height, width, align (for vertical alignment only), and alt.Appearance for Table and Pivot Table WIN
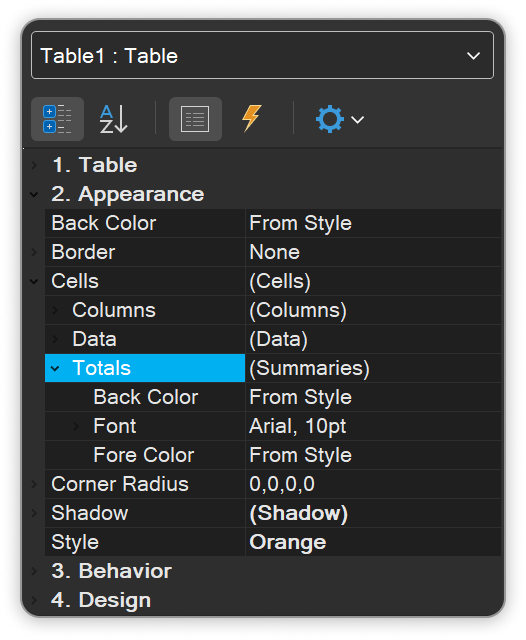
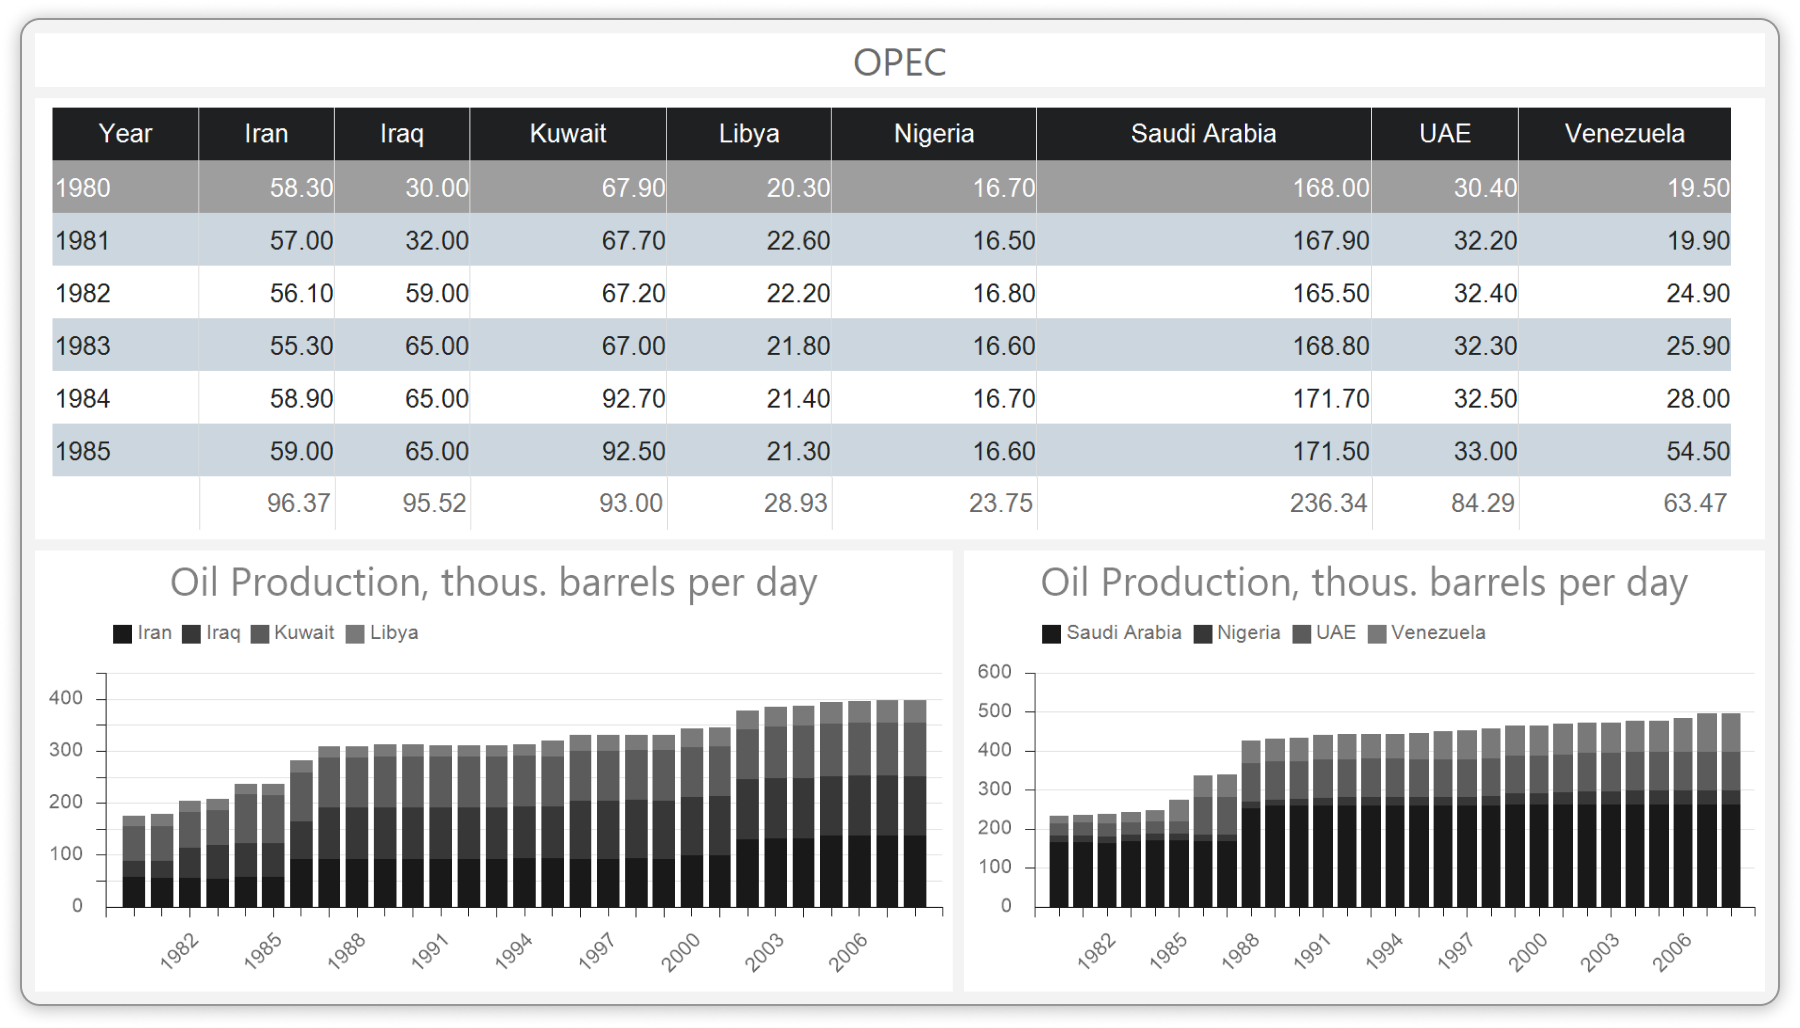
The ability to design headers, cells, and totals has been added to the Table and Pivot Table dashboard elements. Previously, these customizations were limited to the element style settings. Now, by using the Cells property group, you can change the font, text color, and background color for headers, totals, and data cells, providing greater control over the visual appearance of your dashboards.The new style in dashboards
We have introduced a new design style for dashboards and their elements called White Black, along with a new preset style for report components named Style37. To apply the new style, simply select the dashboard and choose the White Black theme from the style menu. The Scale Mode when exporting dashboards
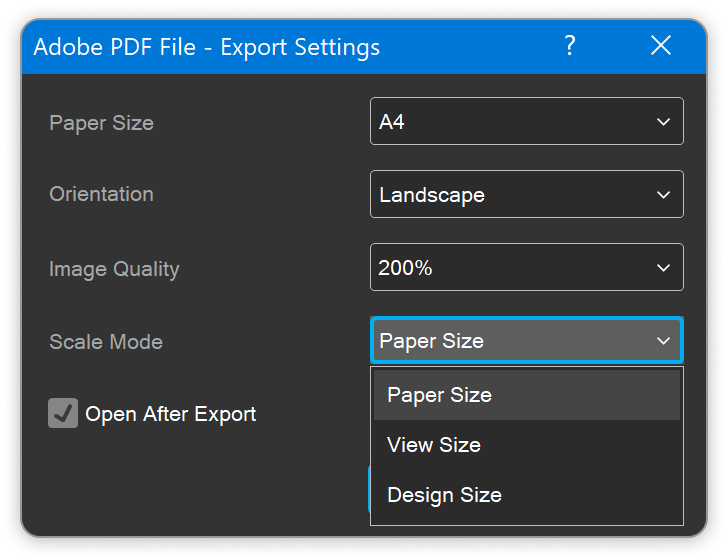
Release 2024.4.1 introduces the ability to define the scaling mode when exporting a dashboard. While in edit mode, the dashboard maintains a fixed size; however, when viewed in the viewer, it automatically scales to fit the viewer area. With the Scale Mode parameter, you can specify the size of the dashboard after export, choosing between the edit mode size or the size as displayed in the viewer.Interactions in Cards and Gauge elements
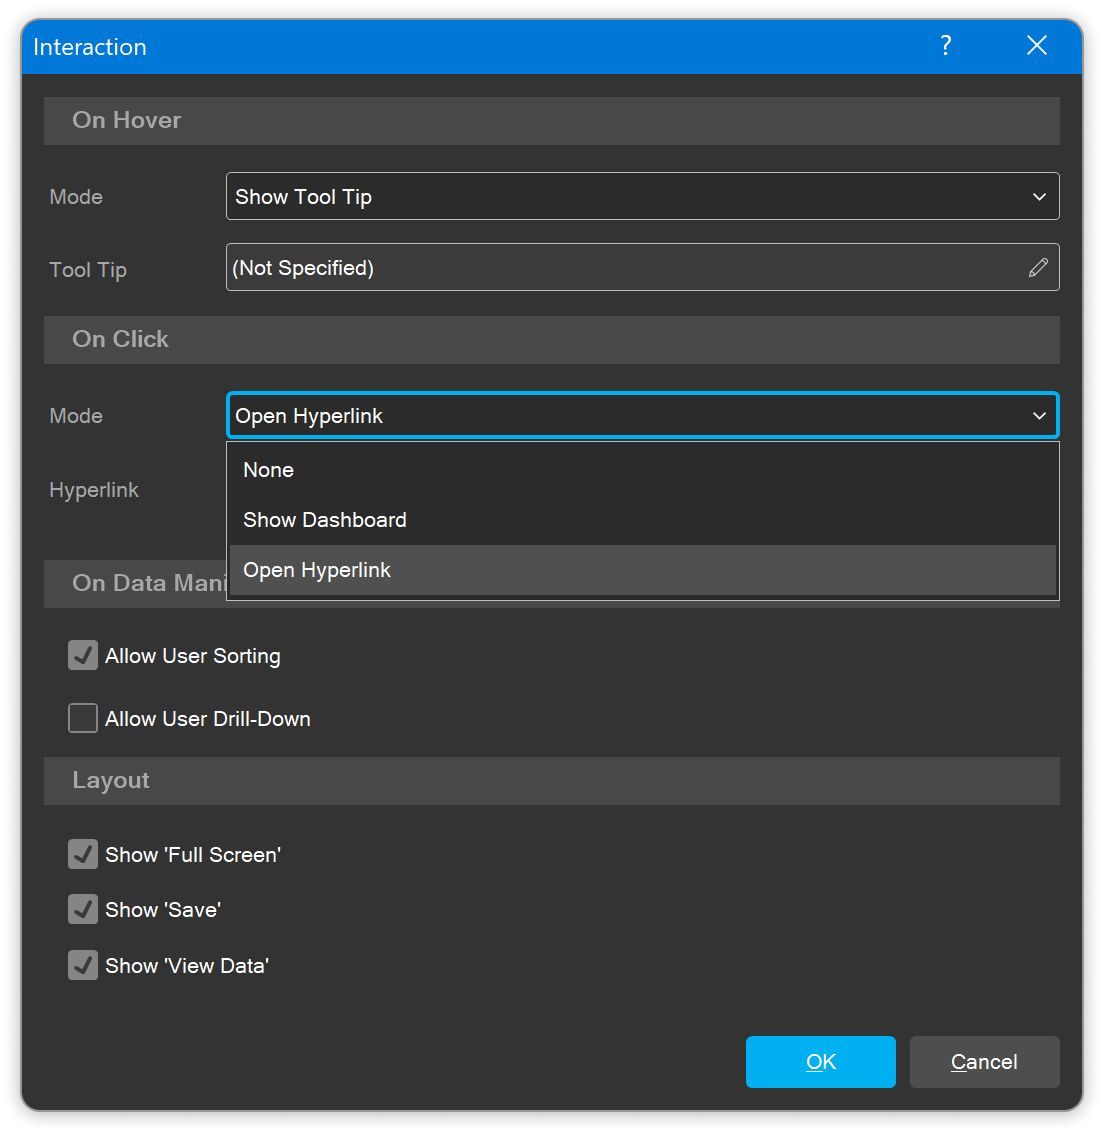
For the Cards and Gauge dashboard elements, we have added support for interactive actions, including Show Tooltip, Show Hyperlink, Show Dashboard, and Open Hyperlink. These settings can be configured in the element interaction editor. Expanding and collapsing in Pivot Table
In the Pivot Table element, adding multiple data fields to rows or columns now creates detail groups that can be collapsed and expanded while viewing the dashboard. Additionally, the Pivot Table element has Expand and Collapse commands, allowing users to expand or collapse all groups at once. These commands can be enabled or disabled in the element's interaction editor, providing greater control over the dashboard's interactivity and user experience.User functions in the events WIN
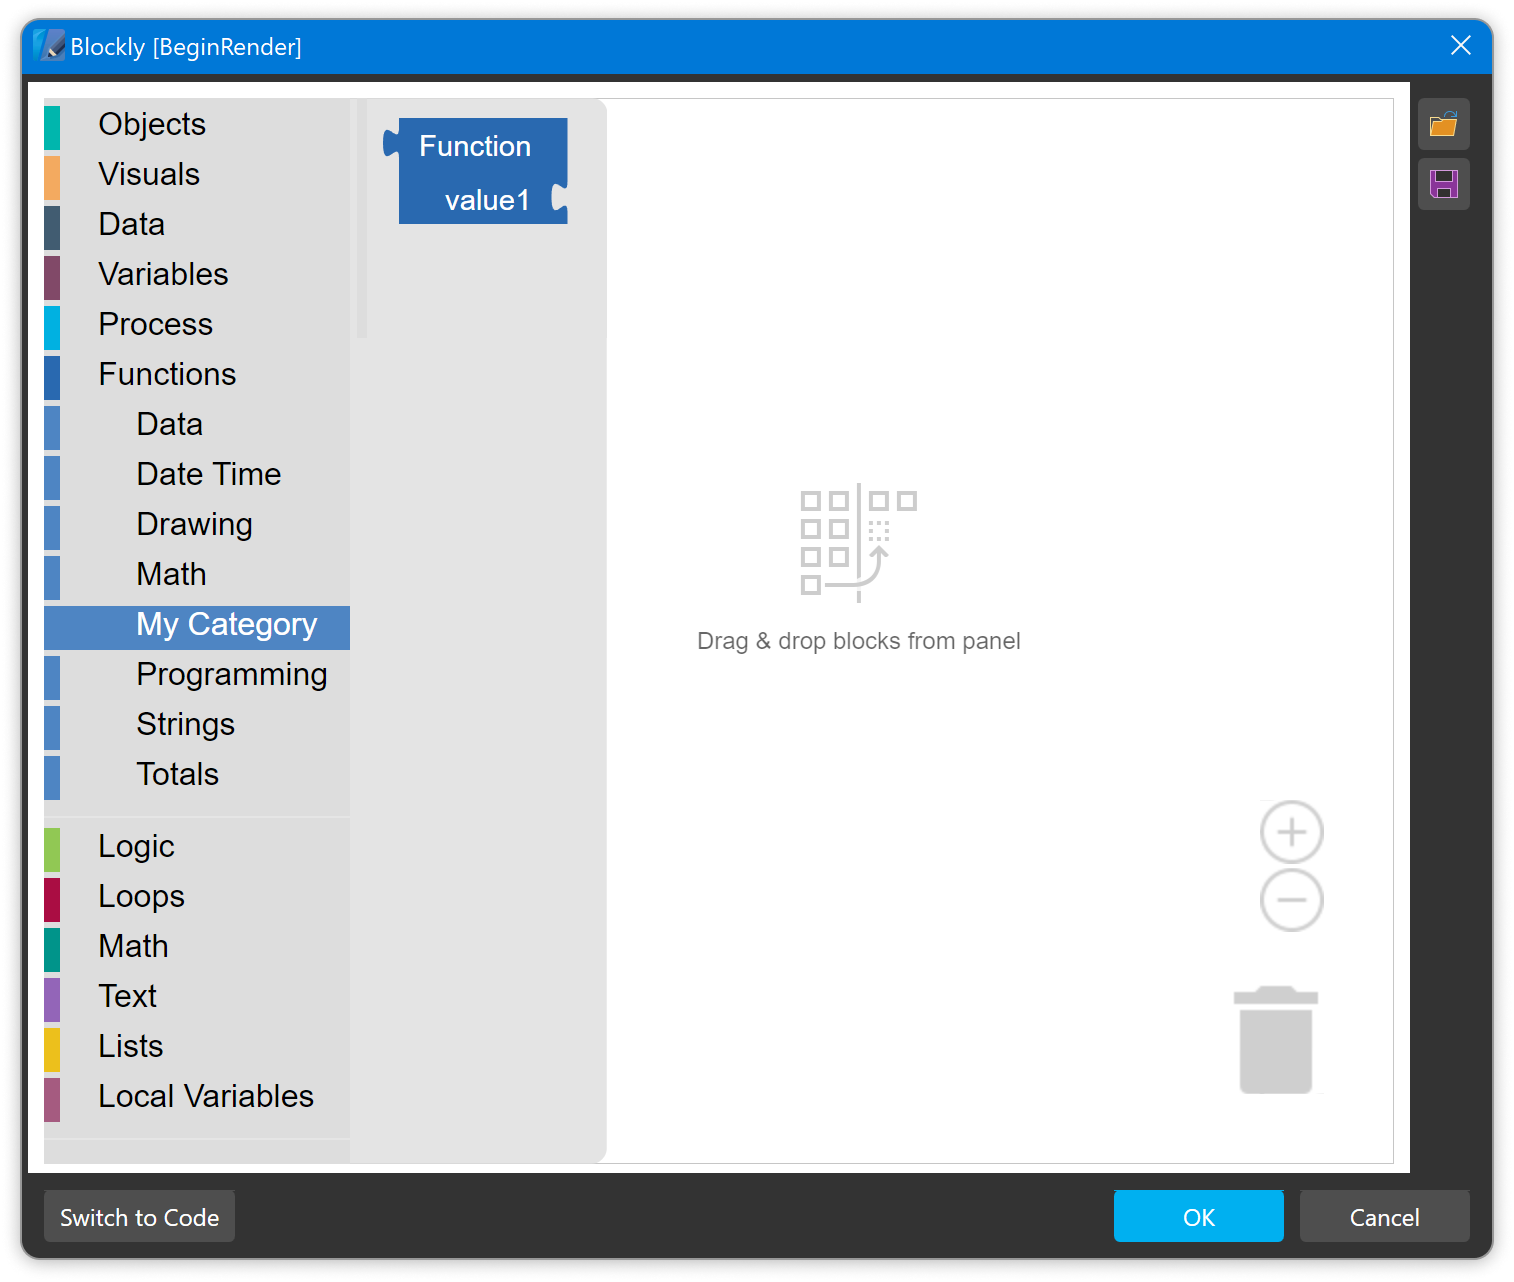
In release 2024.3.1, we introduced the ability to create custom functions in the report designer. Initially, these functions could be utilized in reports and dashboards but not within report events. Now, custom functions can be used in event scripts created using either code or Blockly. Measures in the Text element WIN
You can now create a Measure in the Text dashboard element and utilize it within the text itself. This Measure can include various expressions, such as references to data columns and variables, enhancing the flexibility and functionality of your text elements in dashboards.Column size for the Table element WIN
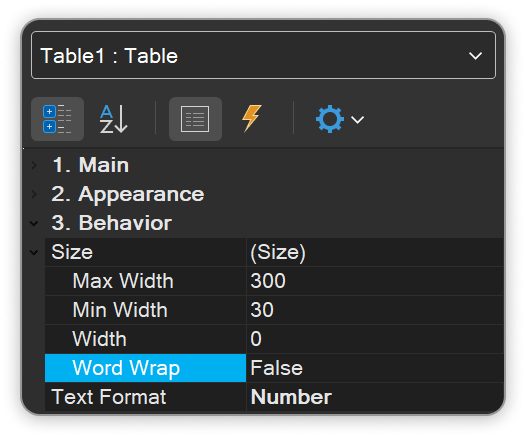
In release 2024.4.1, we introduced the ability to define the width for Measure columns in the Table dashboard element. This can be configured using the Size property group, where you can set a maximum width, minimum width, or a specific width, as well as enable or disable line wrapping.View Name as Chart Title WIN
In dashboard charts, you can now create multiple Views, allowing a single element to display up to 5 different charts. However, previously, only one title could be assigned to a chart element. In this release, we have added the ability to use the view name as the element title. This feature can be enabled using the Show 'Title' parameter located in the view settings menu.Constant Lines and Strips for 3D Charts
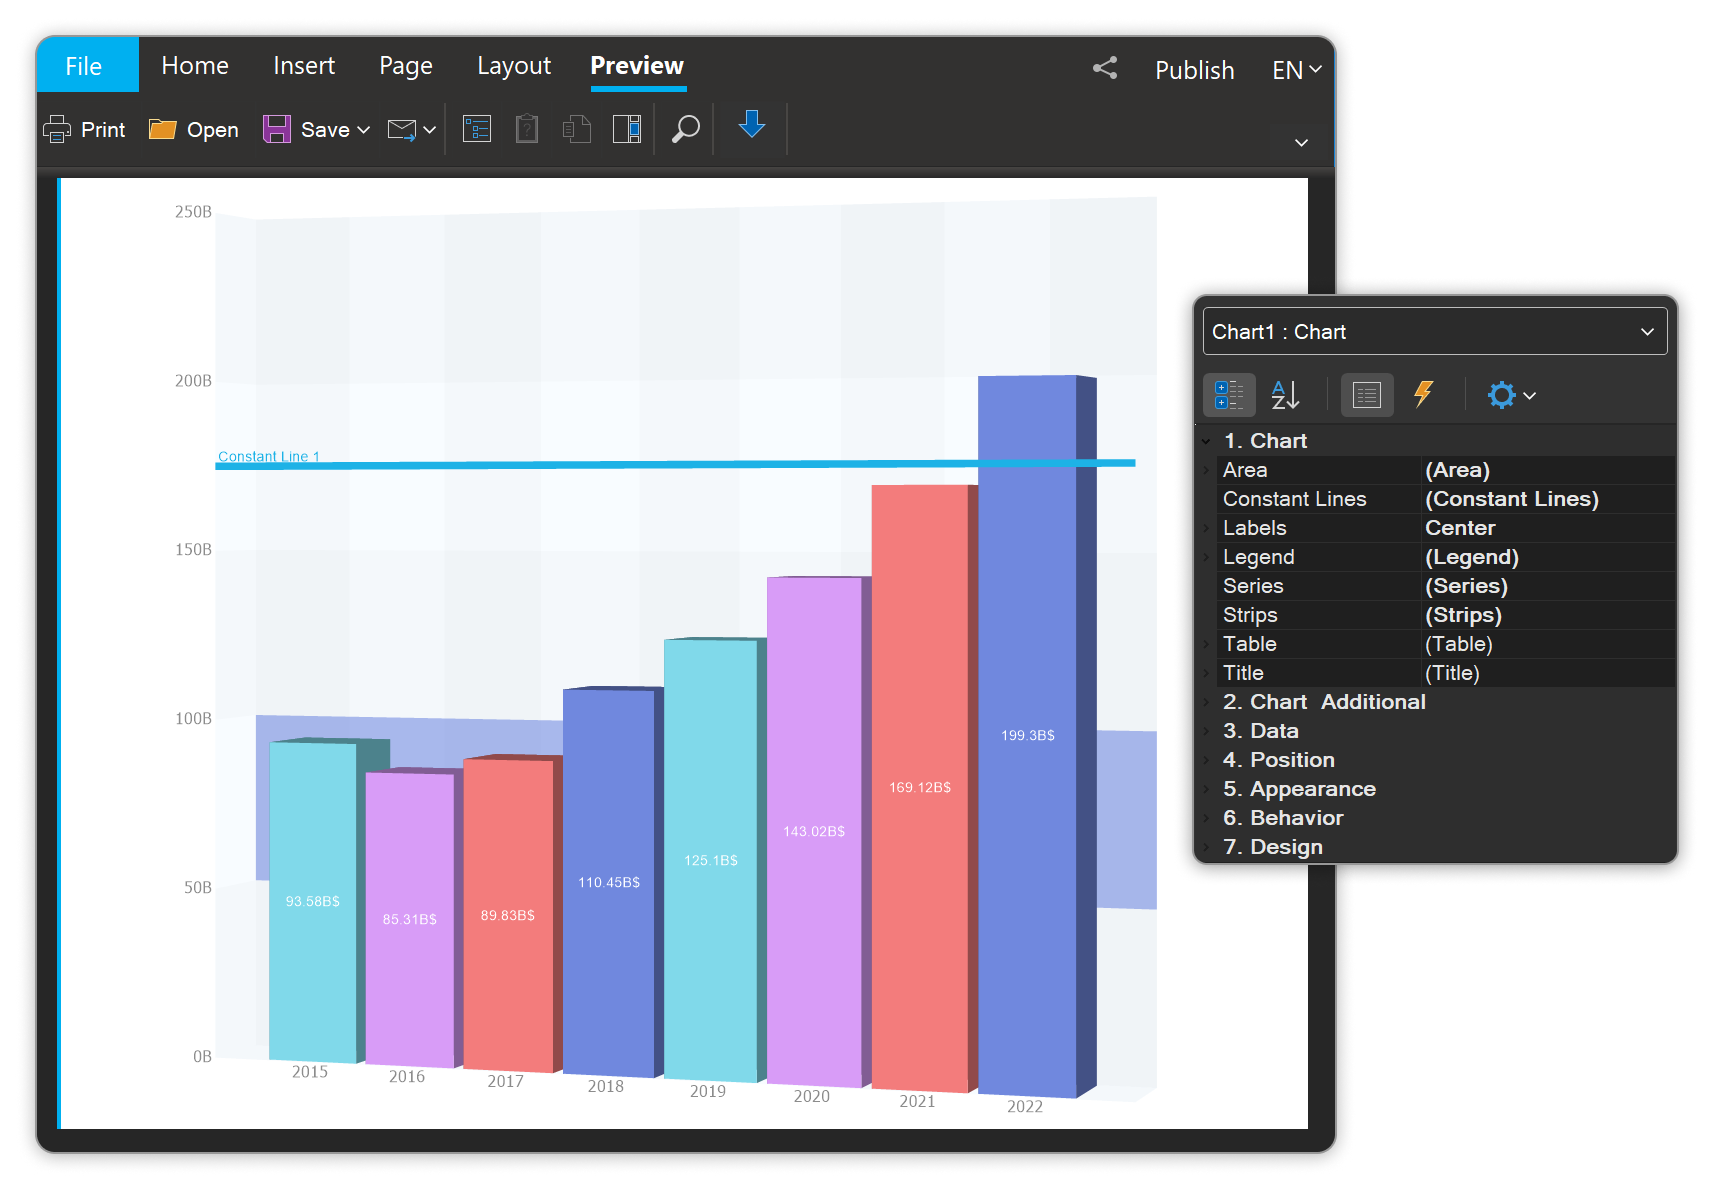
The ability to use Constant Lines and Strips has been added for 3D charts in reports and dashboards. These features can be configured in the same manner as for 2D charts, allowing for consistent styling and enhanced data visualization across different chart types. Support ClickHouse adapter WIN
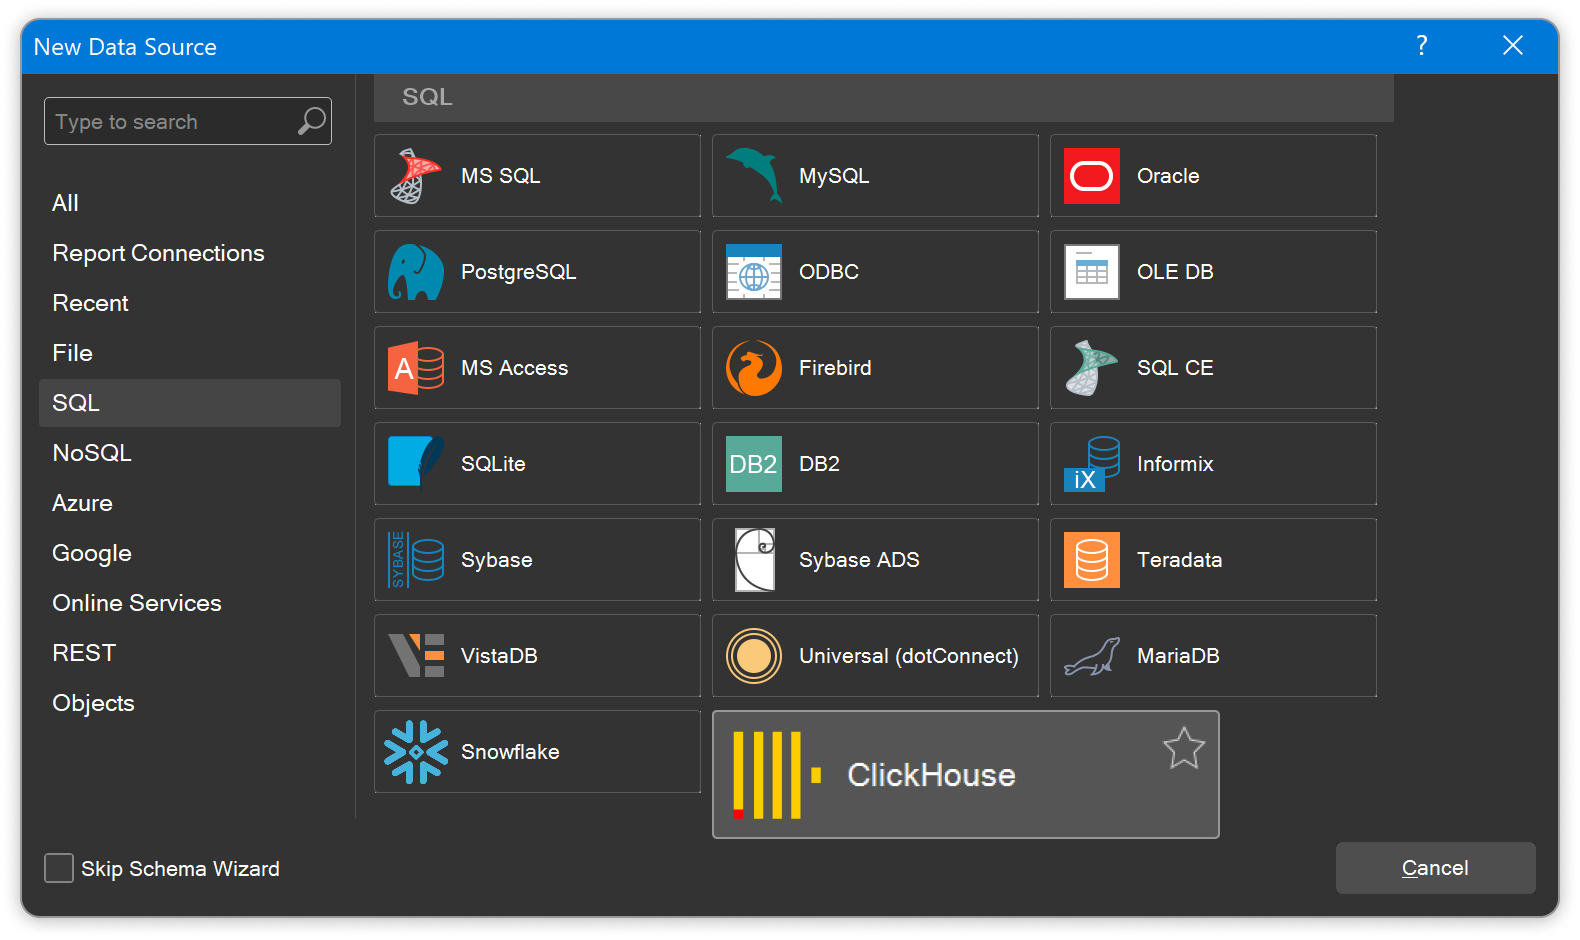
Starting with release 2024.4, you can now connect to the ClickHouse online data storage and exchange service directly from the report designer. To establish this connection, simply select the ClickHouse type in the data source creation window and specify the connection string to your data warehouse.