We are pleased to announce the release of the new version Stimulsoft Reports and Stimulsoft Dashboards 2021.2, which is now available for download. In this release, we added a new product - Stimulsoft Reports.Blazor, a new component Math Formulas, a new data adapter Azure Blob Storage, export dashboards to HTML format, support for HTML tags in PDF, and many other improvements.
Support for Blazor
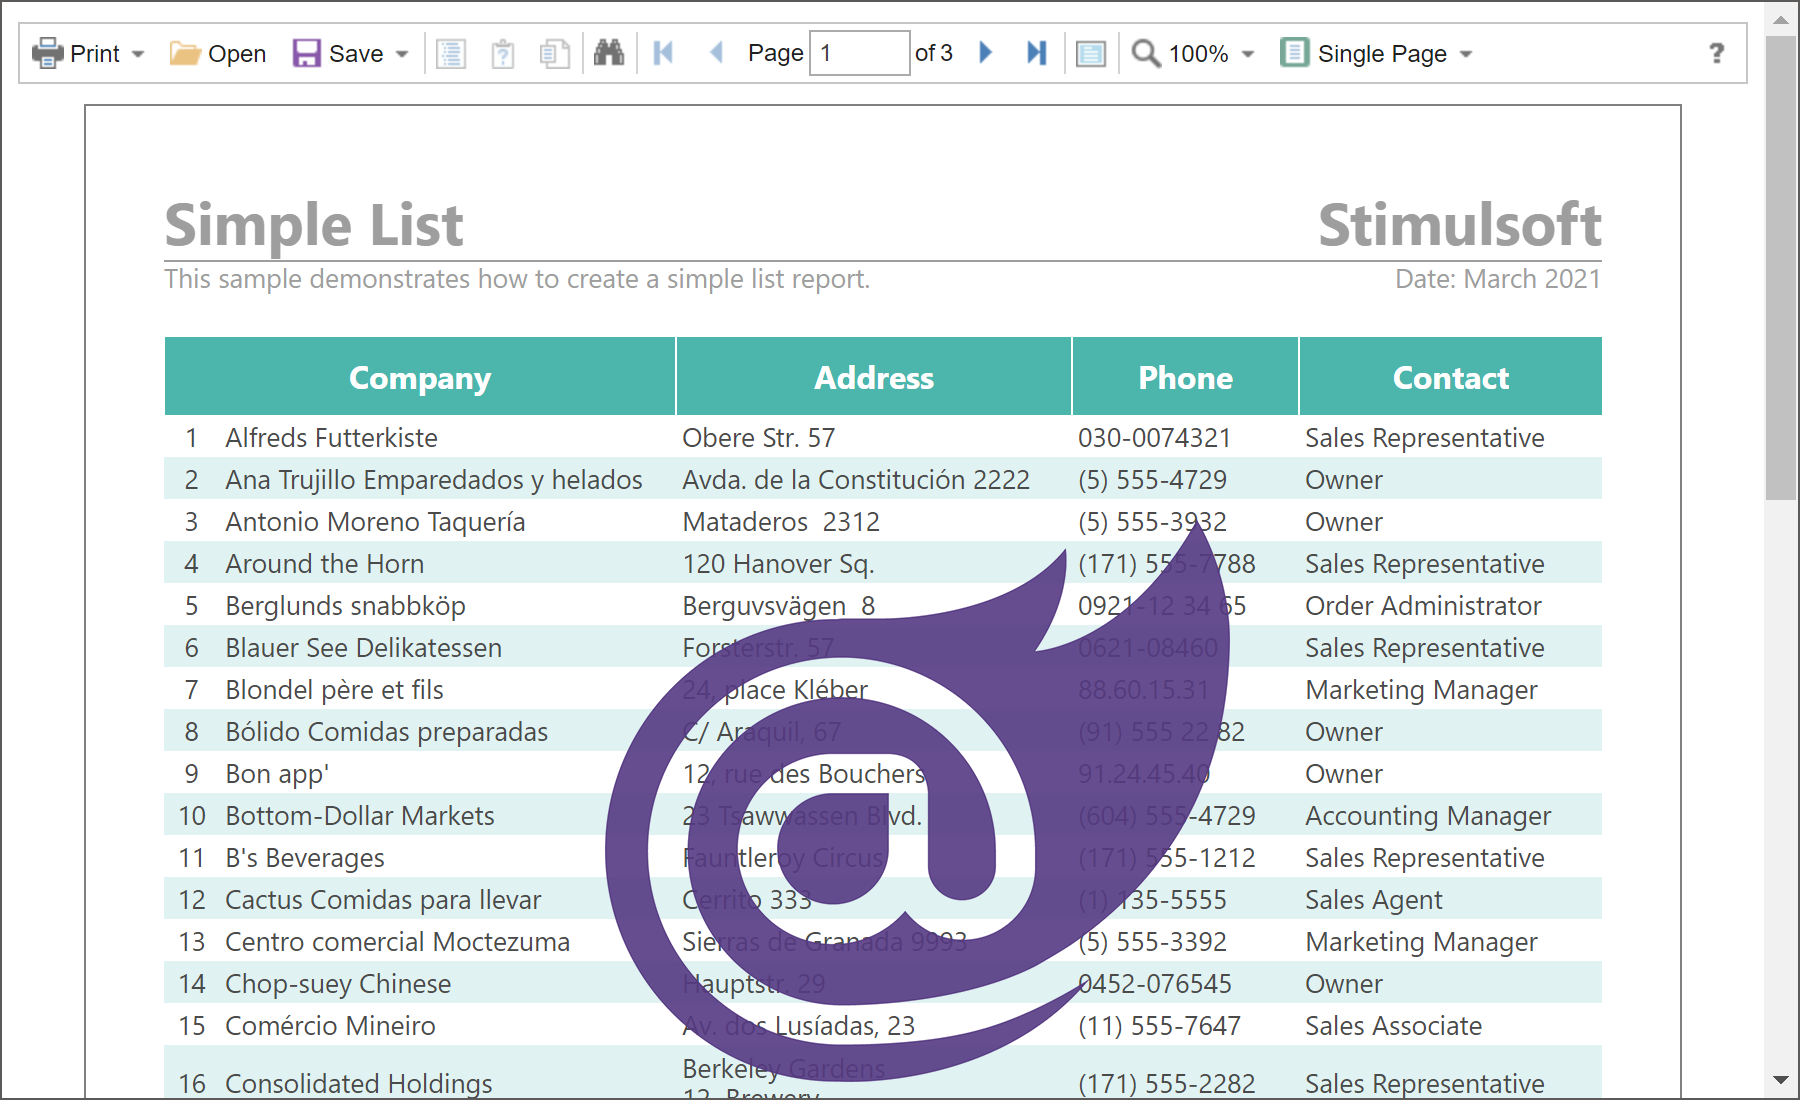
Starting with the 2021.2 release, we are introducing the reporting tool for the Blazor platform. It is a cross-platform software designed for integration into applications using the Blazor framework. Our components support Razor Pages technology. They may work both on the server-side (Blazor Server) and client-side (Blazor WebAssembly). All you need is a Web browser. This report writer is part of Stimulsoft Reports.Web.
Mathematical formulas
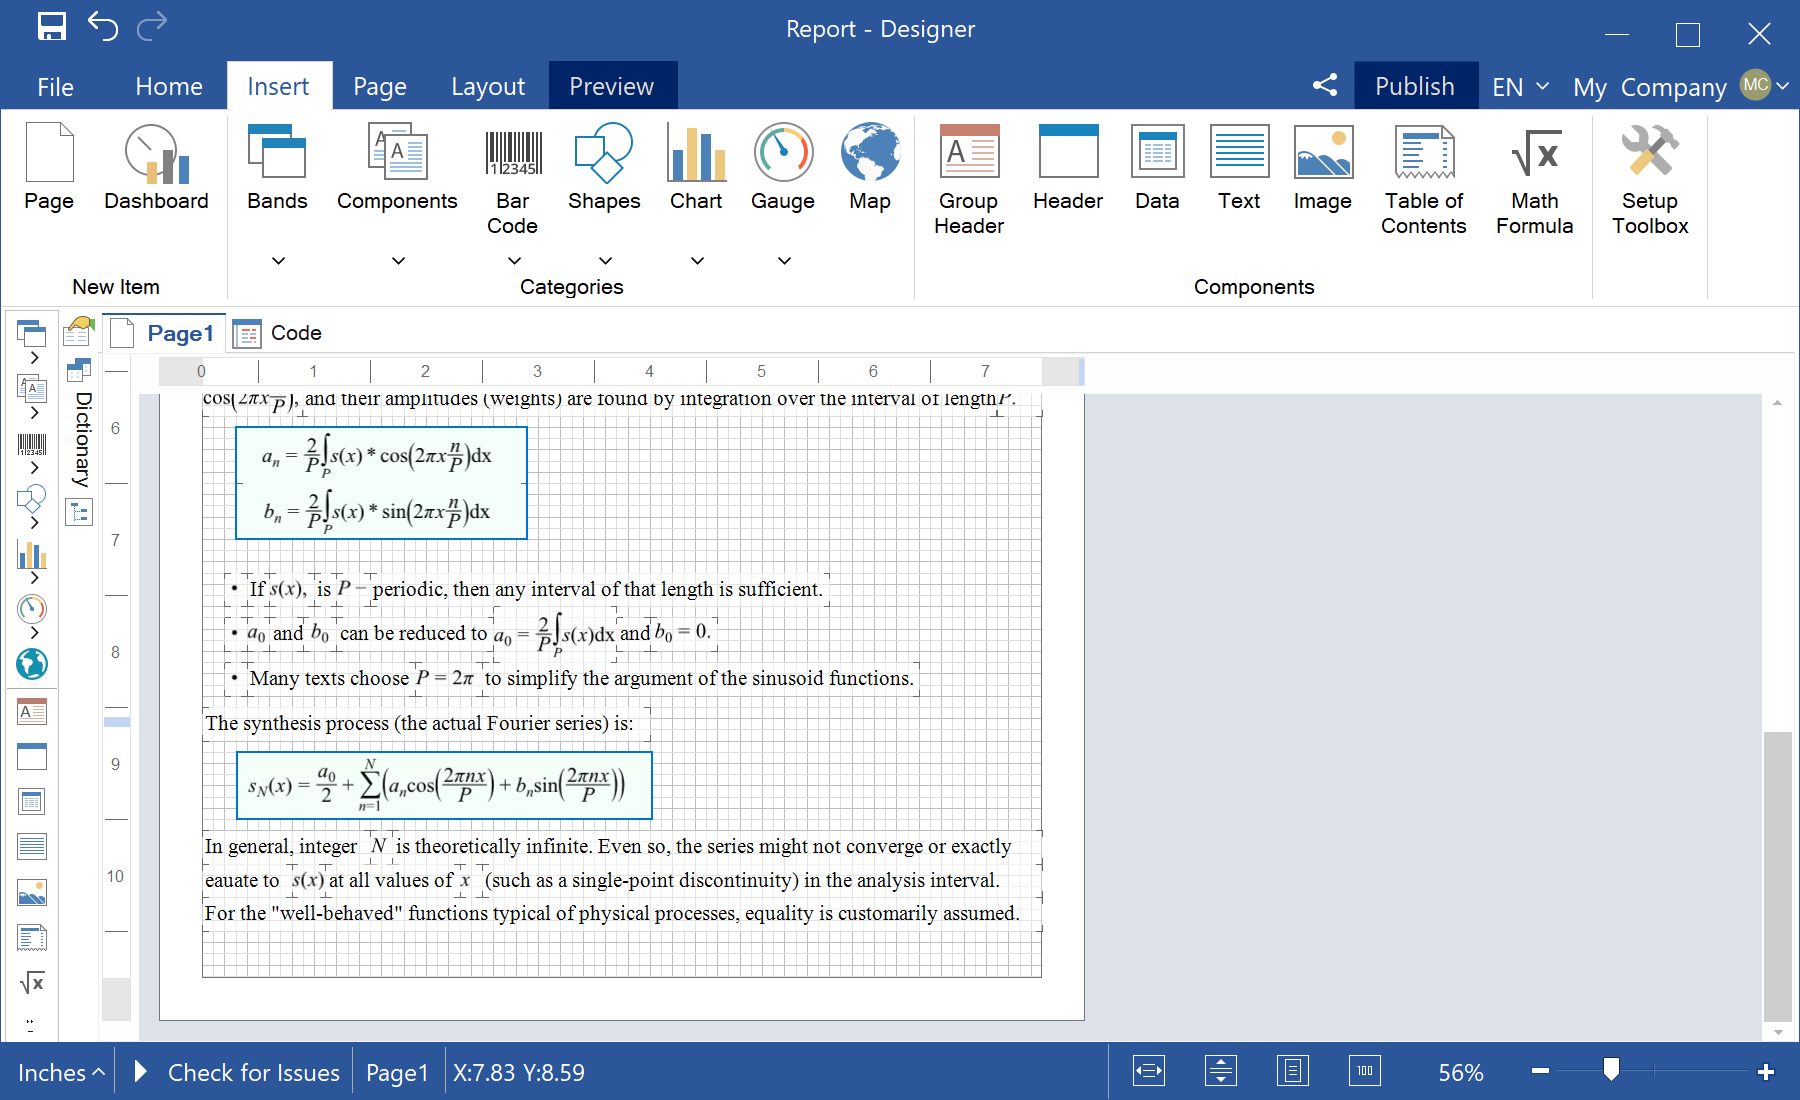
In the new version, you can insert math formulas in your reports using the special Math Formula component. All mathematical formulas are arranged in groups in the special editor, where each group can be found on a separate tab. Also, you can specify the formula using LaTeX syntax.
New data adapters - Azure SQL and Azure Blob Storage
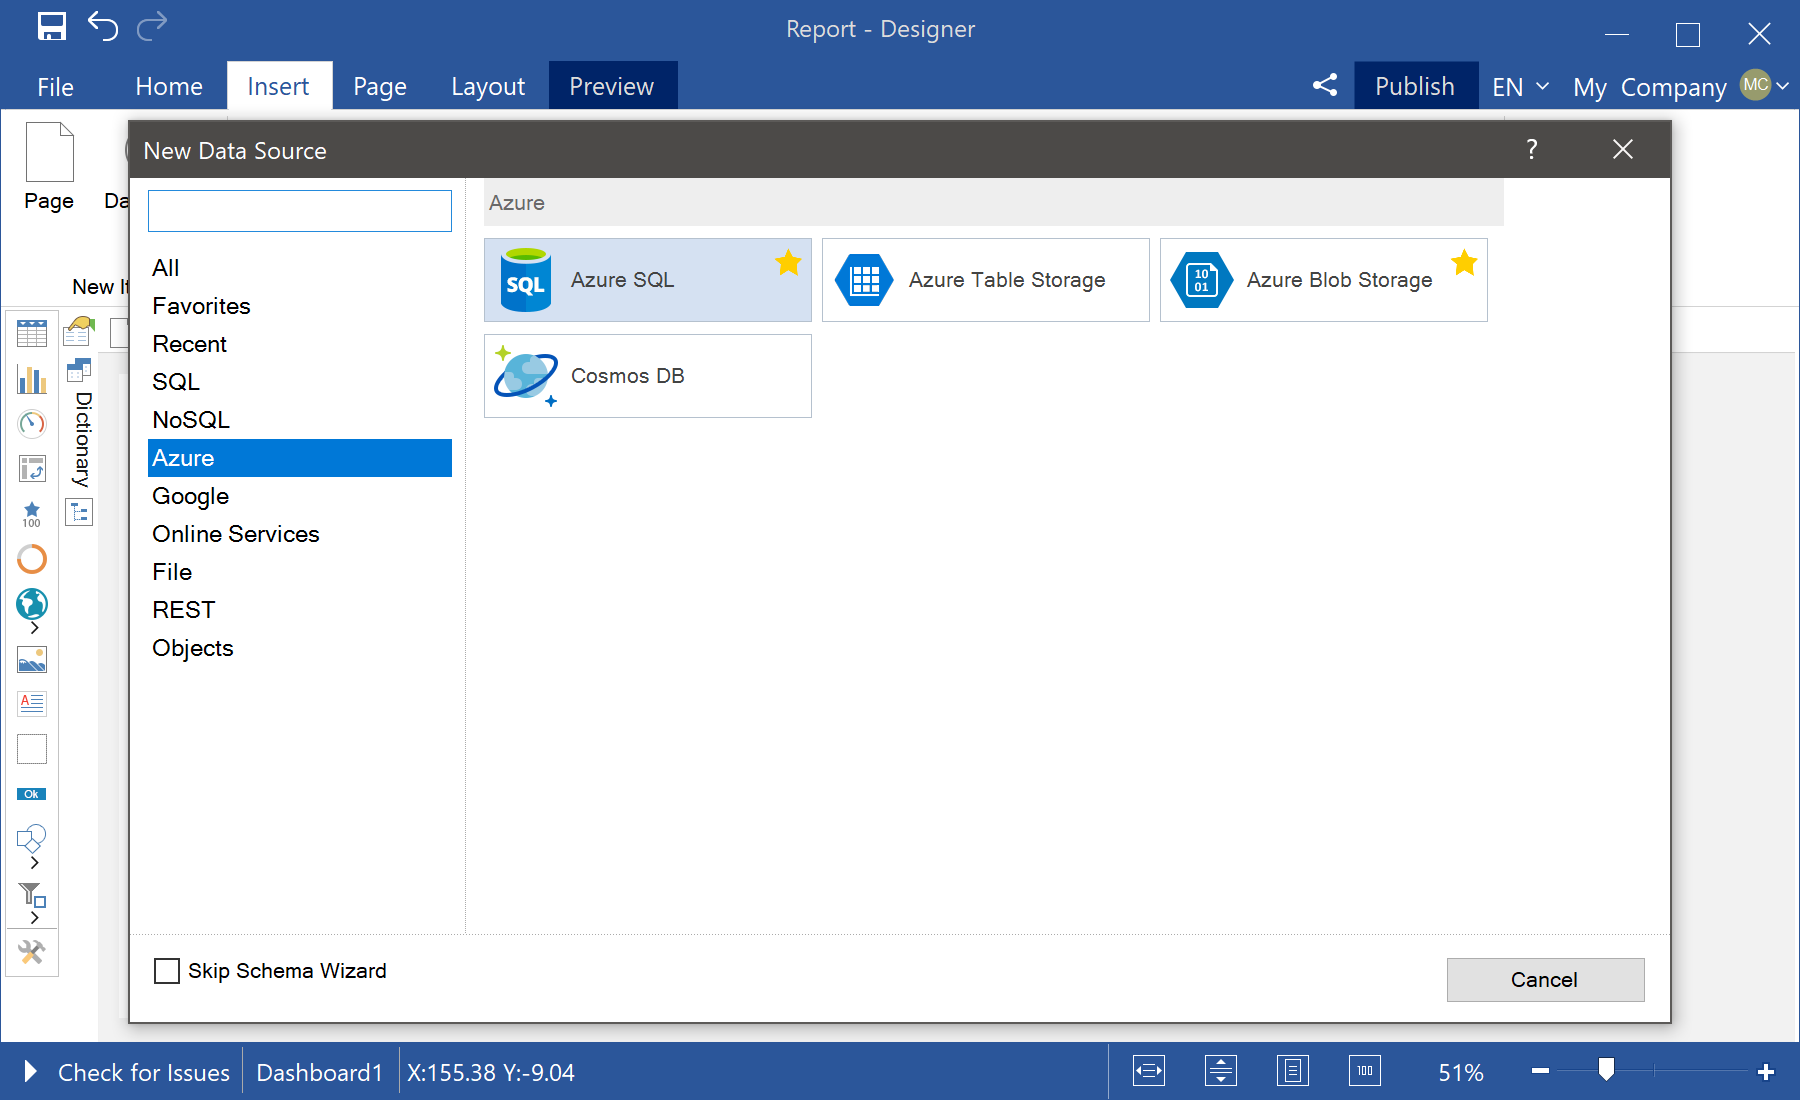
In this new release, we have added new adapters to fetch data from services such as Azure SQL and Azure Blob Storage. You may find them on a separate Azure tab in the New Data Source window. Based on the data obtained from these services, you can create reports and dashboards.
Dashboard positioning
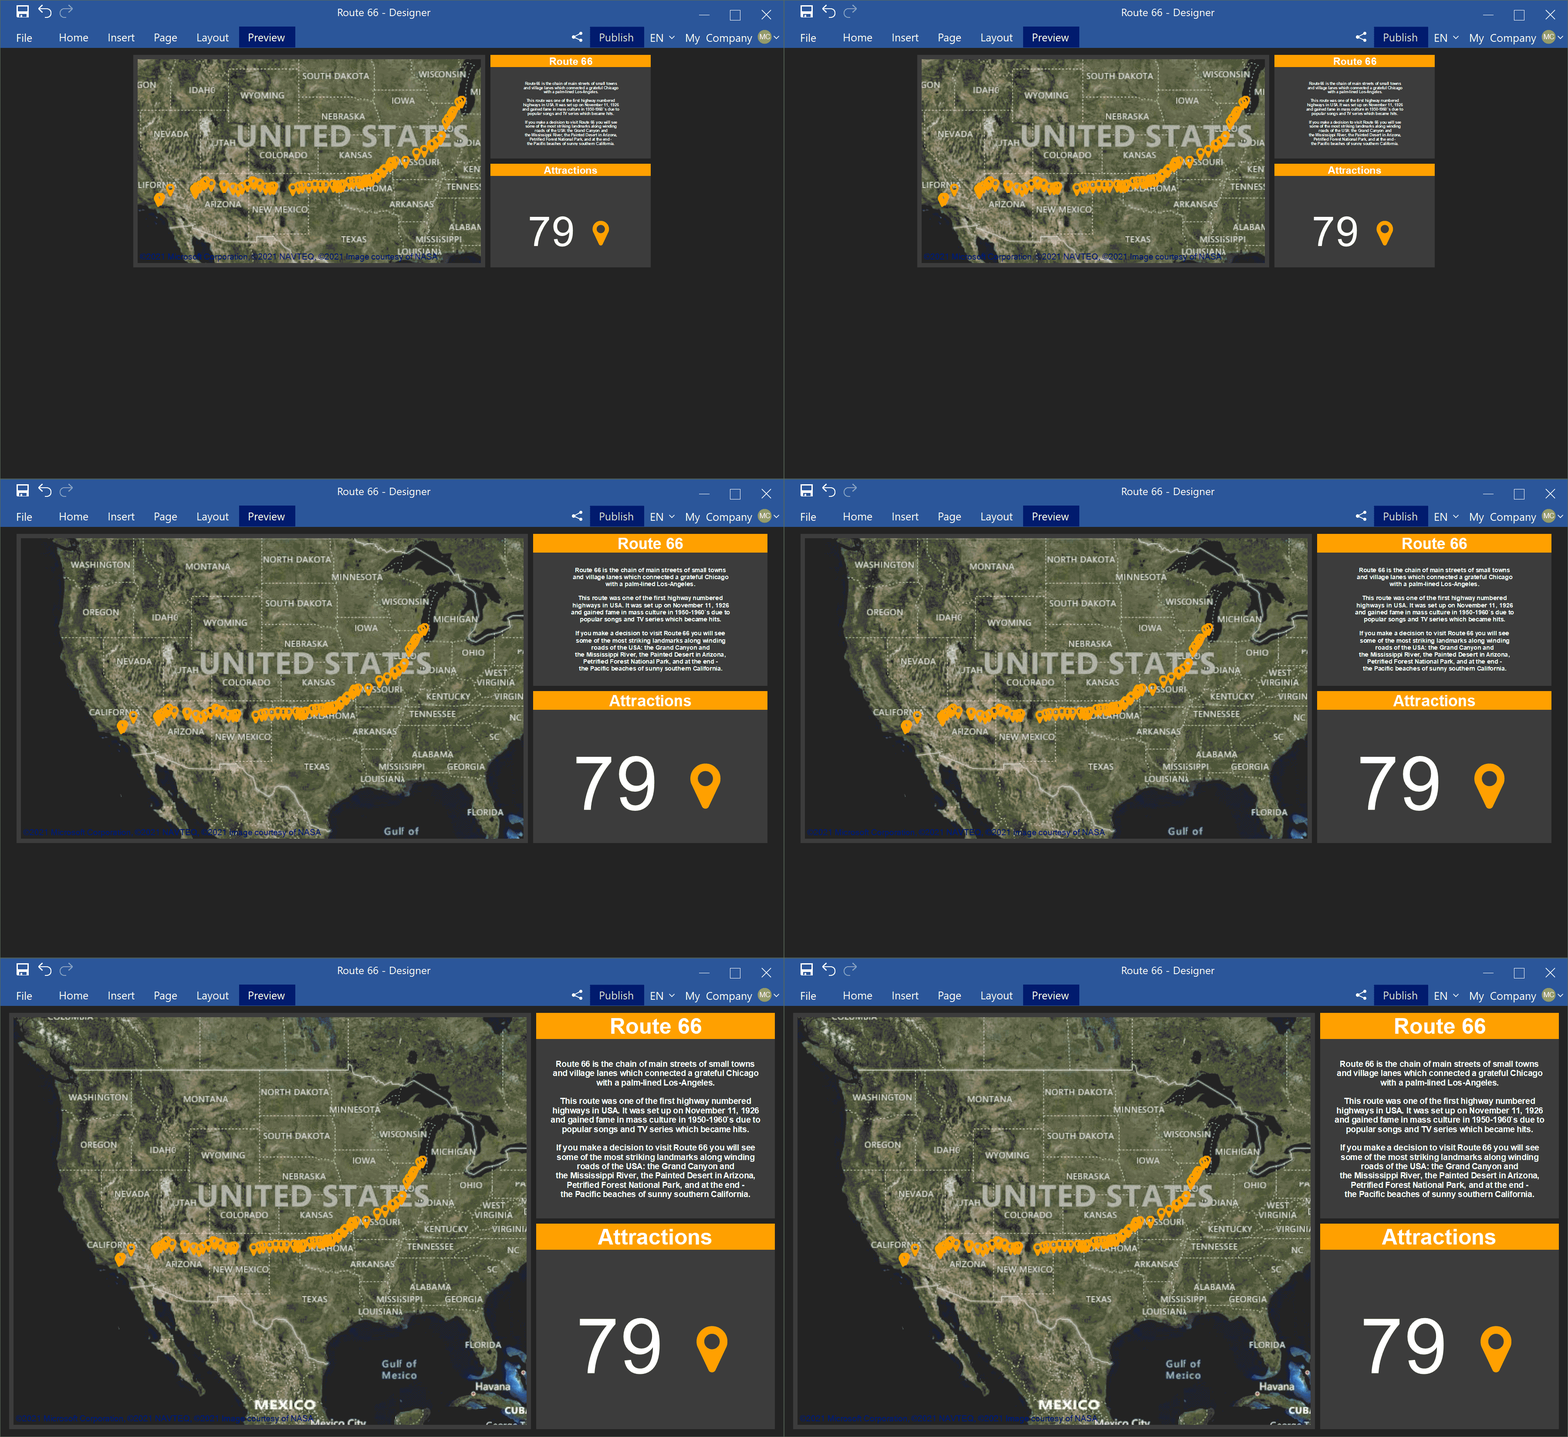
Starting with this release, you can define the behavior of the dashboard when viewed. Previously, you could stretch the dashboard to the entire area of the viewer by height and width. Now you may extend it only by the width, height and width for the whole area of the viewer or not to stretch it at all. To specify the behavior of the dashboard, open the Dashboard settings window and set the value of the Content Alignment parameter. Double-click the workspace or select the Design command from the dashboard context menu to call the dashboard settings.
Export a dashboard to HTML
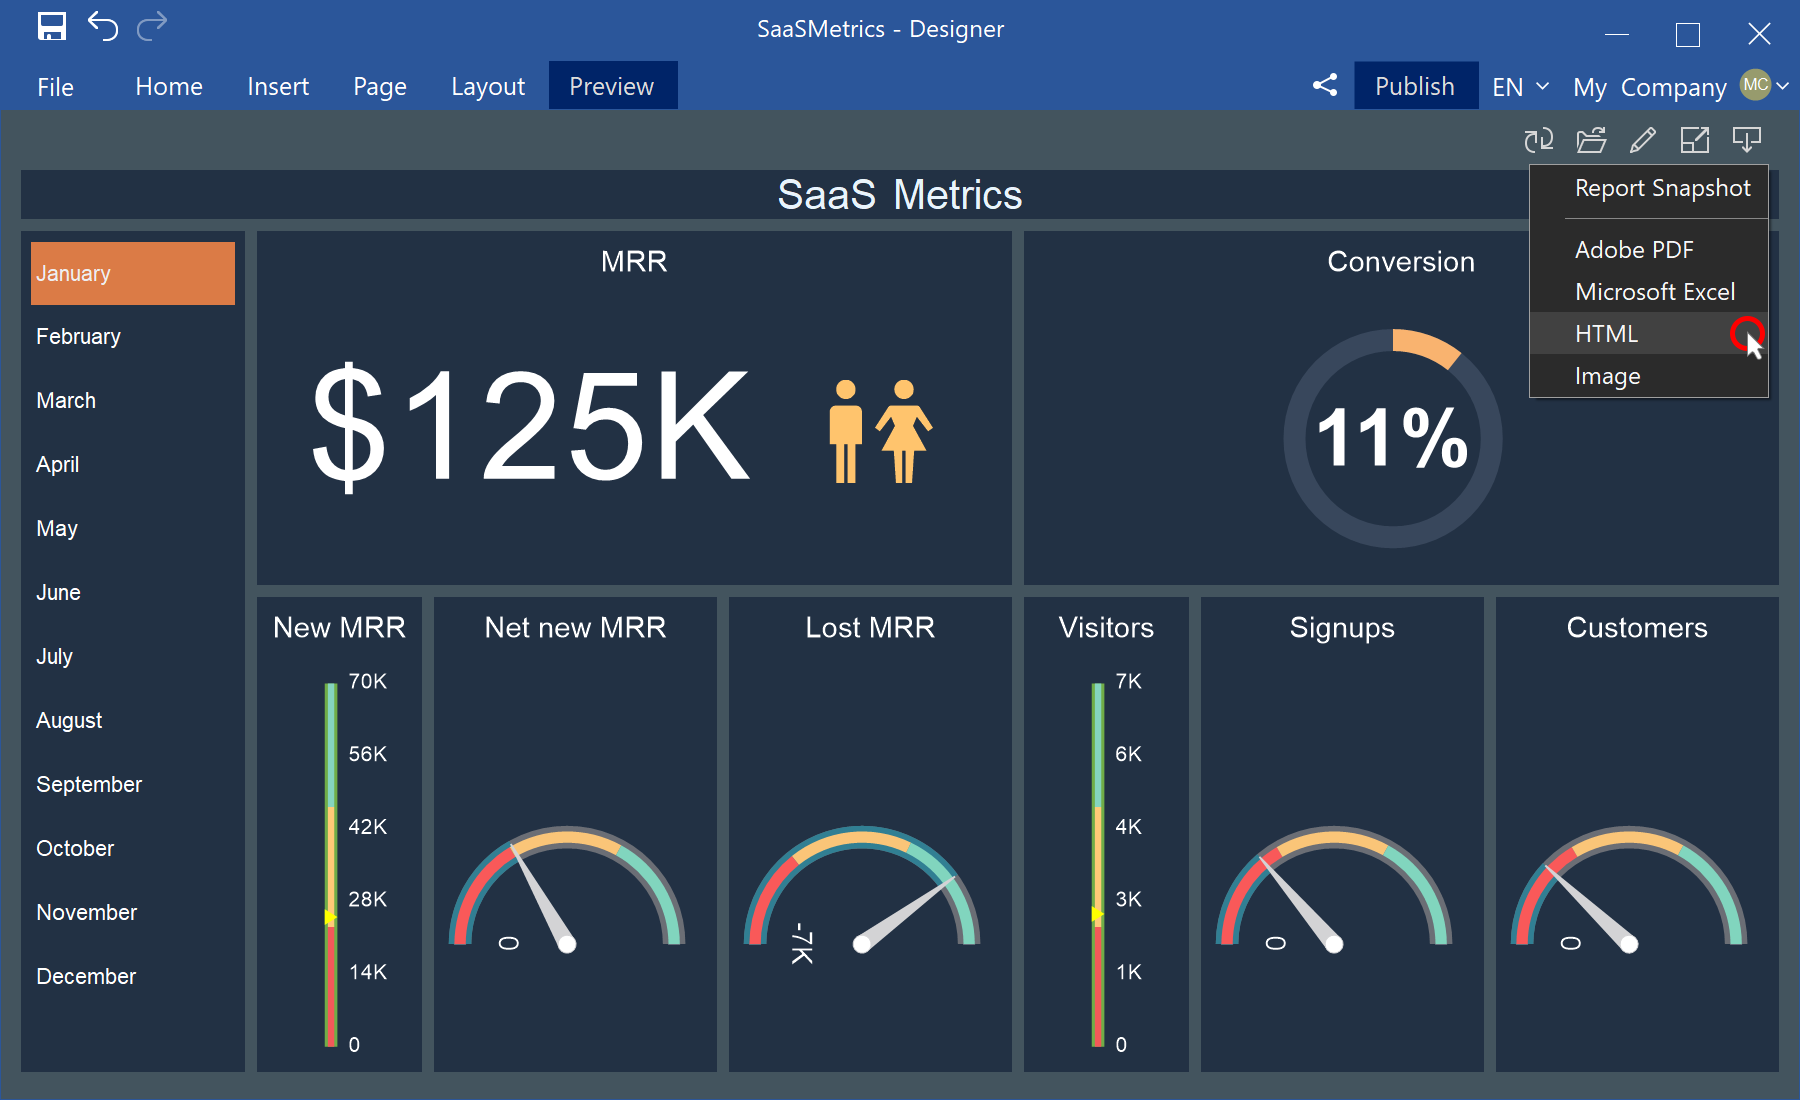
In this release, we have added the ability to convert the dashboard and its elements to an HTML file. Open the dashboard in the viewer, go to the preview and select the HTML command from the Save menu on the toolbar or in a similar menu for a specific element. After that, the dashboard or its element will be converted into an HTML file.
New variable features
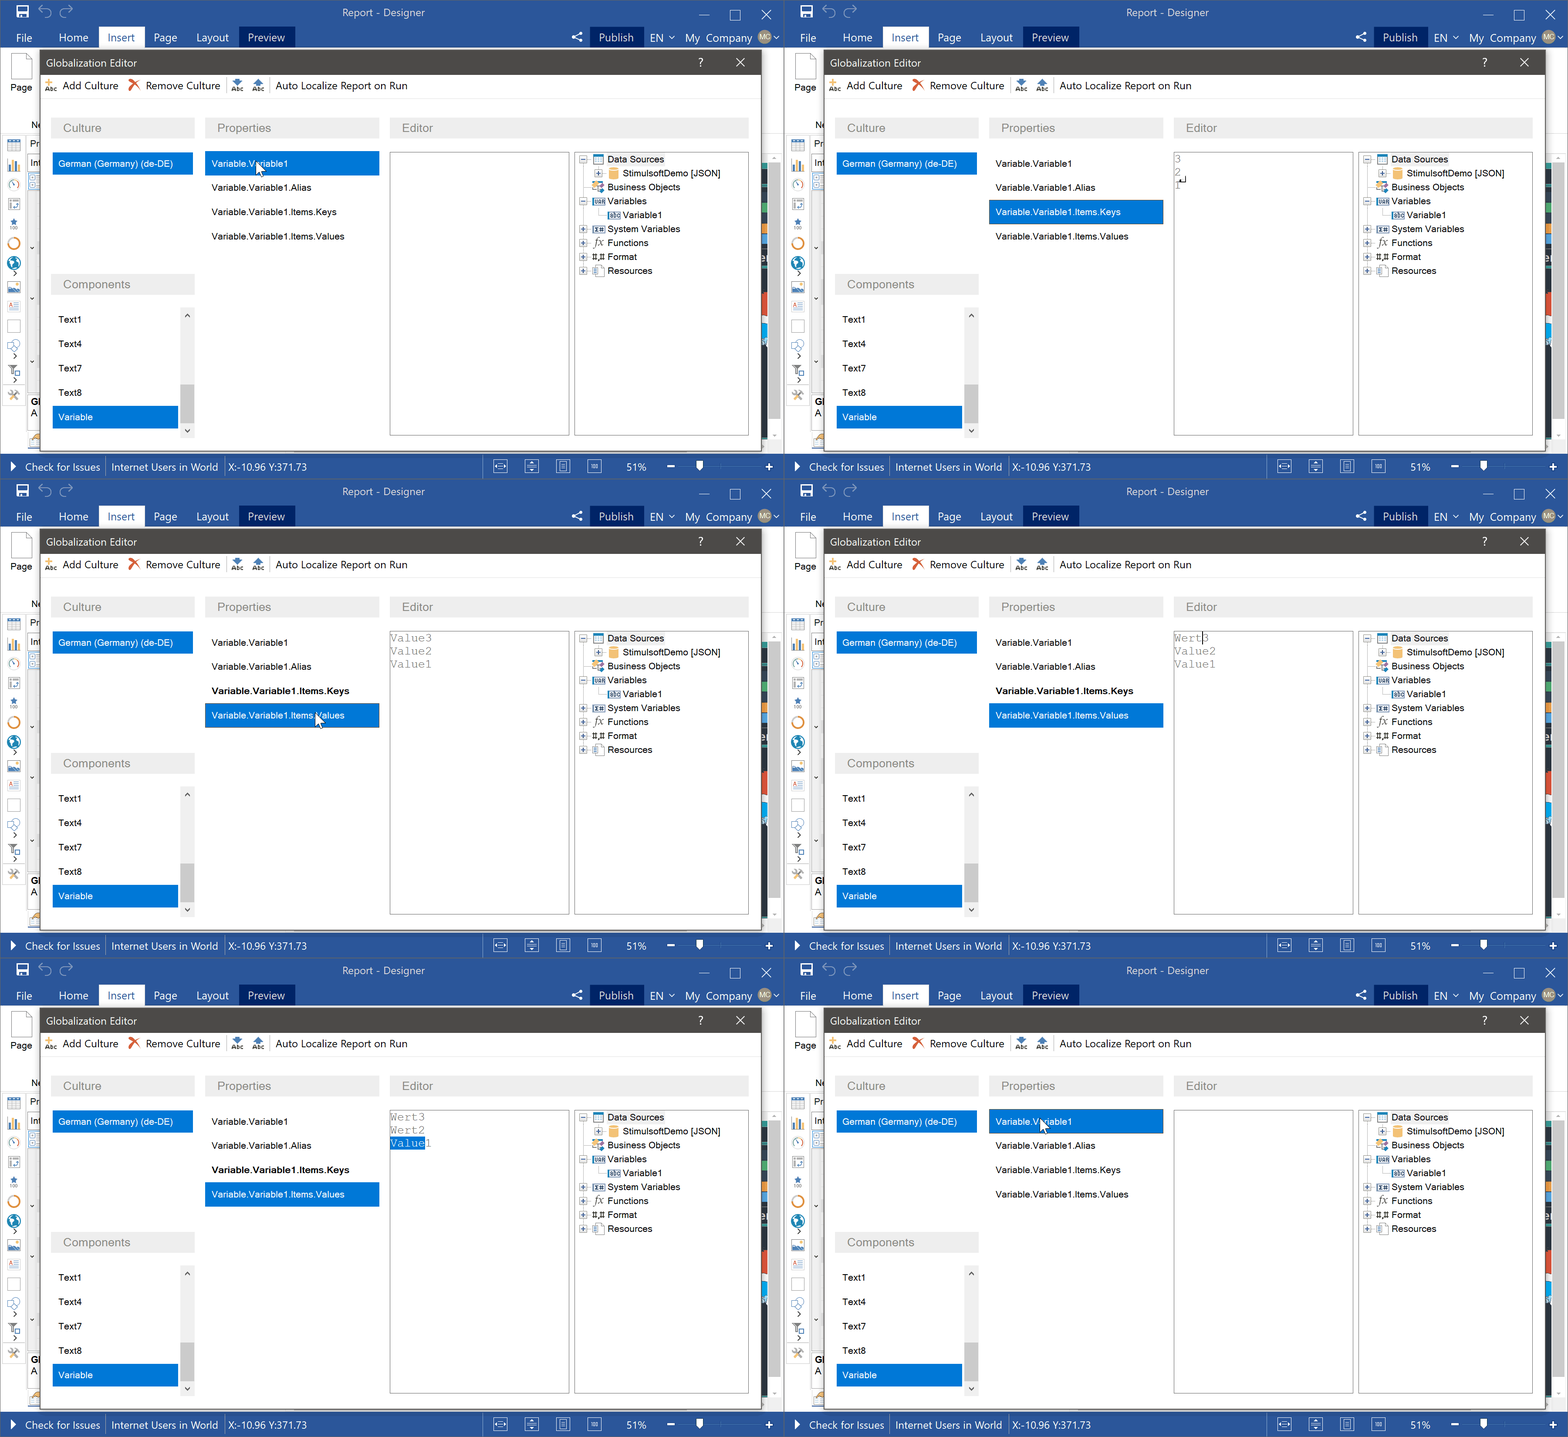
In this release, we have significantly optimized and improved the capabilities of report variables. You may customize the globalization of variable elements in the Globalization Strings editor. And when creating or editing a variable with the Request from User option enabled, you can specify the sorting of the values of this variable in the viewer. Moreover, sorting can be carried out both by the key values of the variable and by signatures. Also, in reports, you can refer to the signatures of variable values using the following template - VariableName.Label.
Digital signature certificate
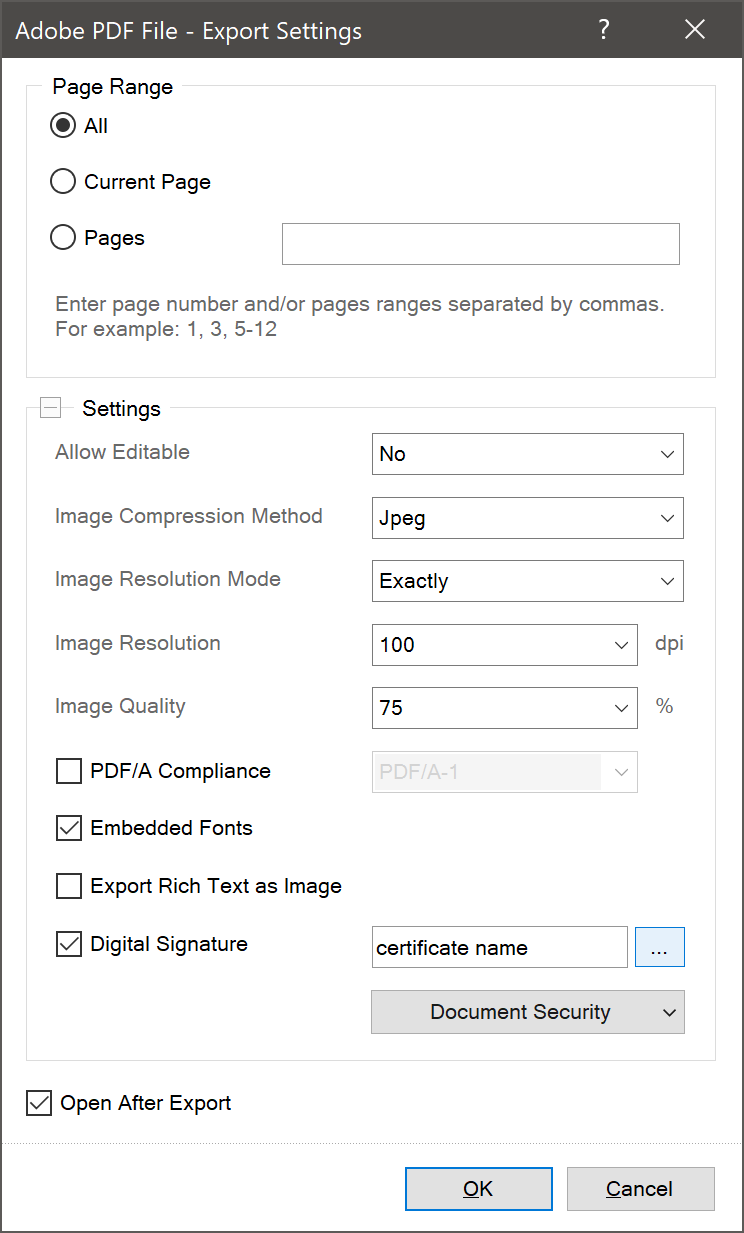
In the 2021.2 release, we simplified the digital signature certificate selection directly from the export settings menu when converting a report to PDF. Click the Browse button in the Digital Signature field and select a certificate.
The new dashboard feature - Percent Of Grand Total
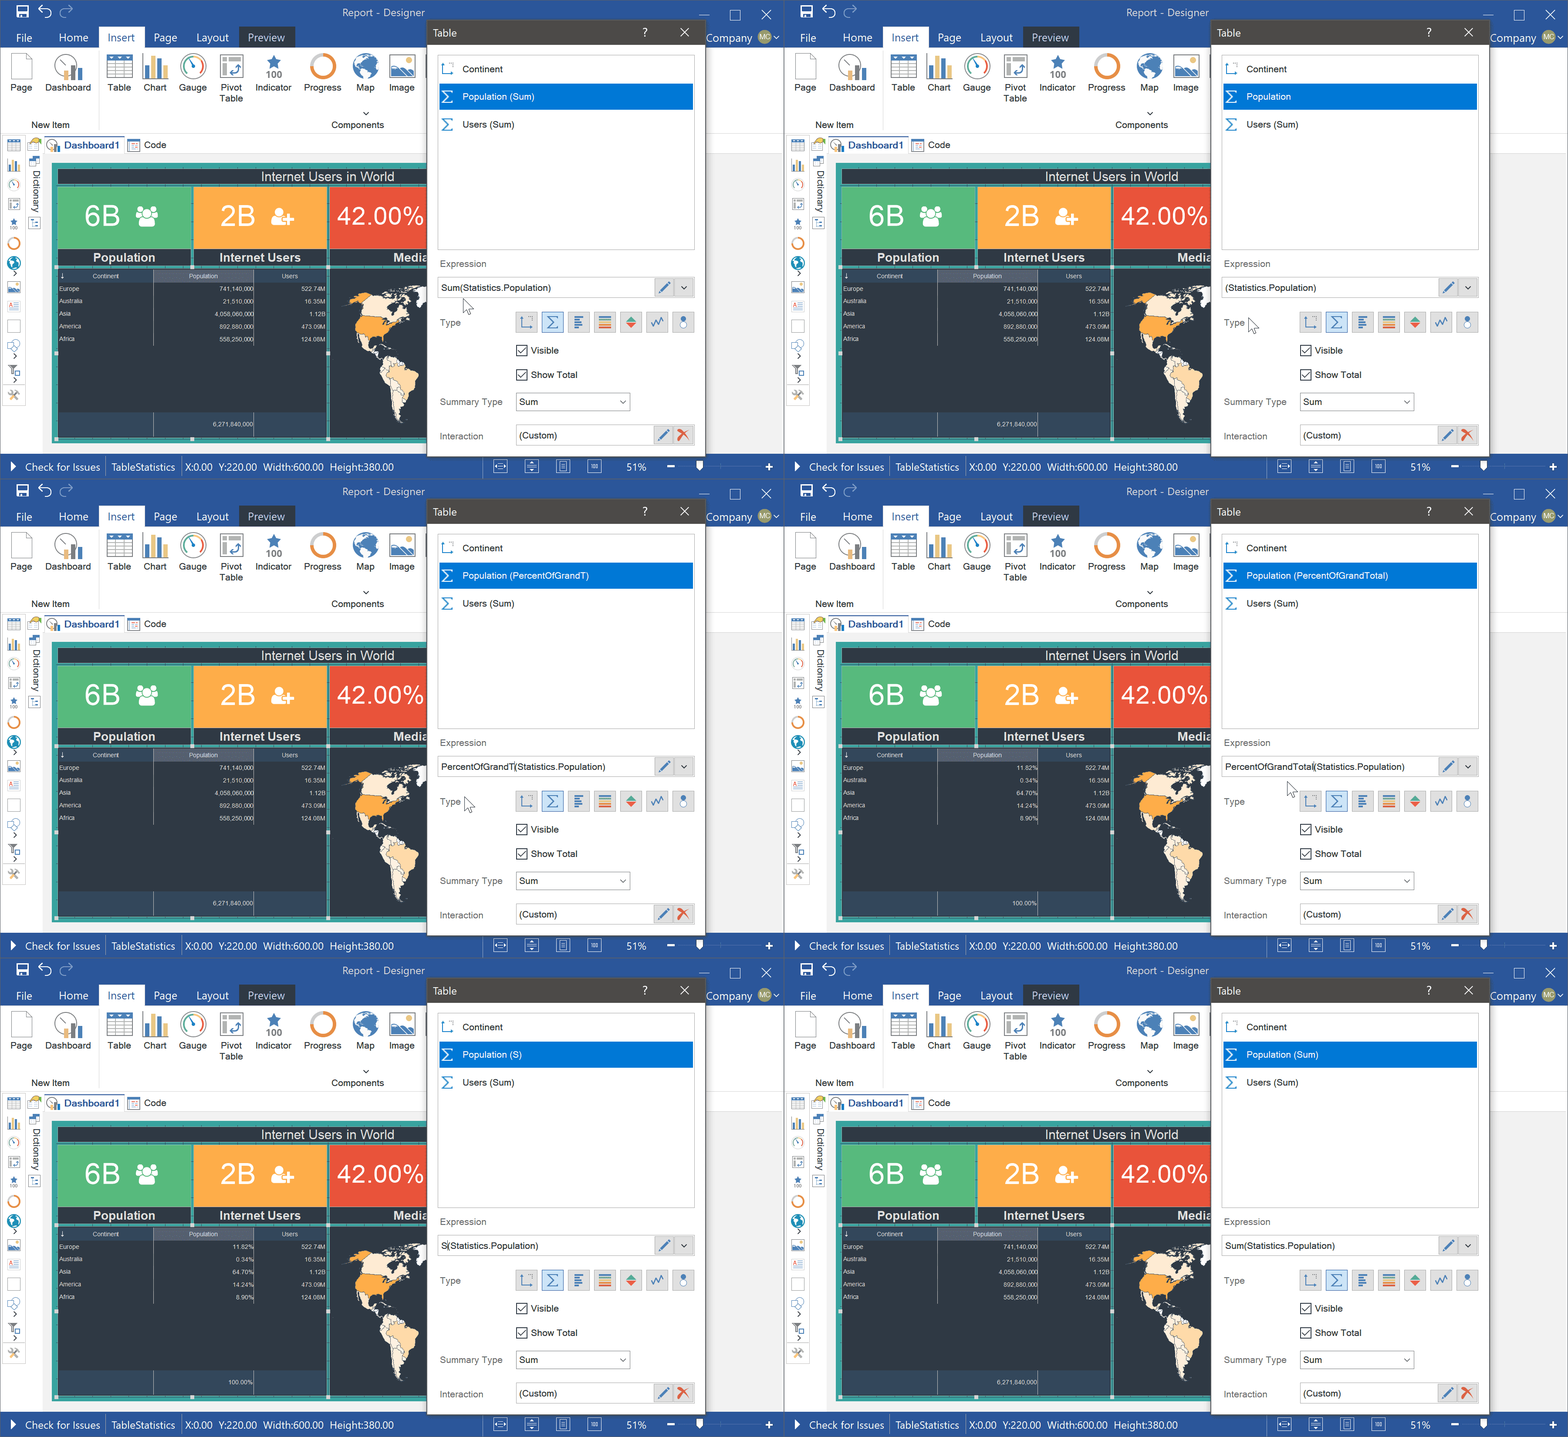
We have added a new function Percent Of Grand Total for the Measure type of dashboard elements. You may use the new function to display the fraction of the current value from the sum of the values of this data field. To show percentages, apply percentage formatting to the field where values are processed using the Percent Of Grand Total function.
Support for HTML tags in PDF
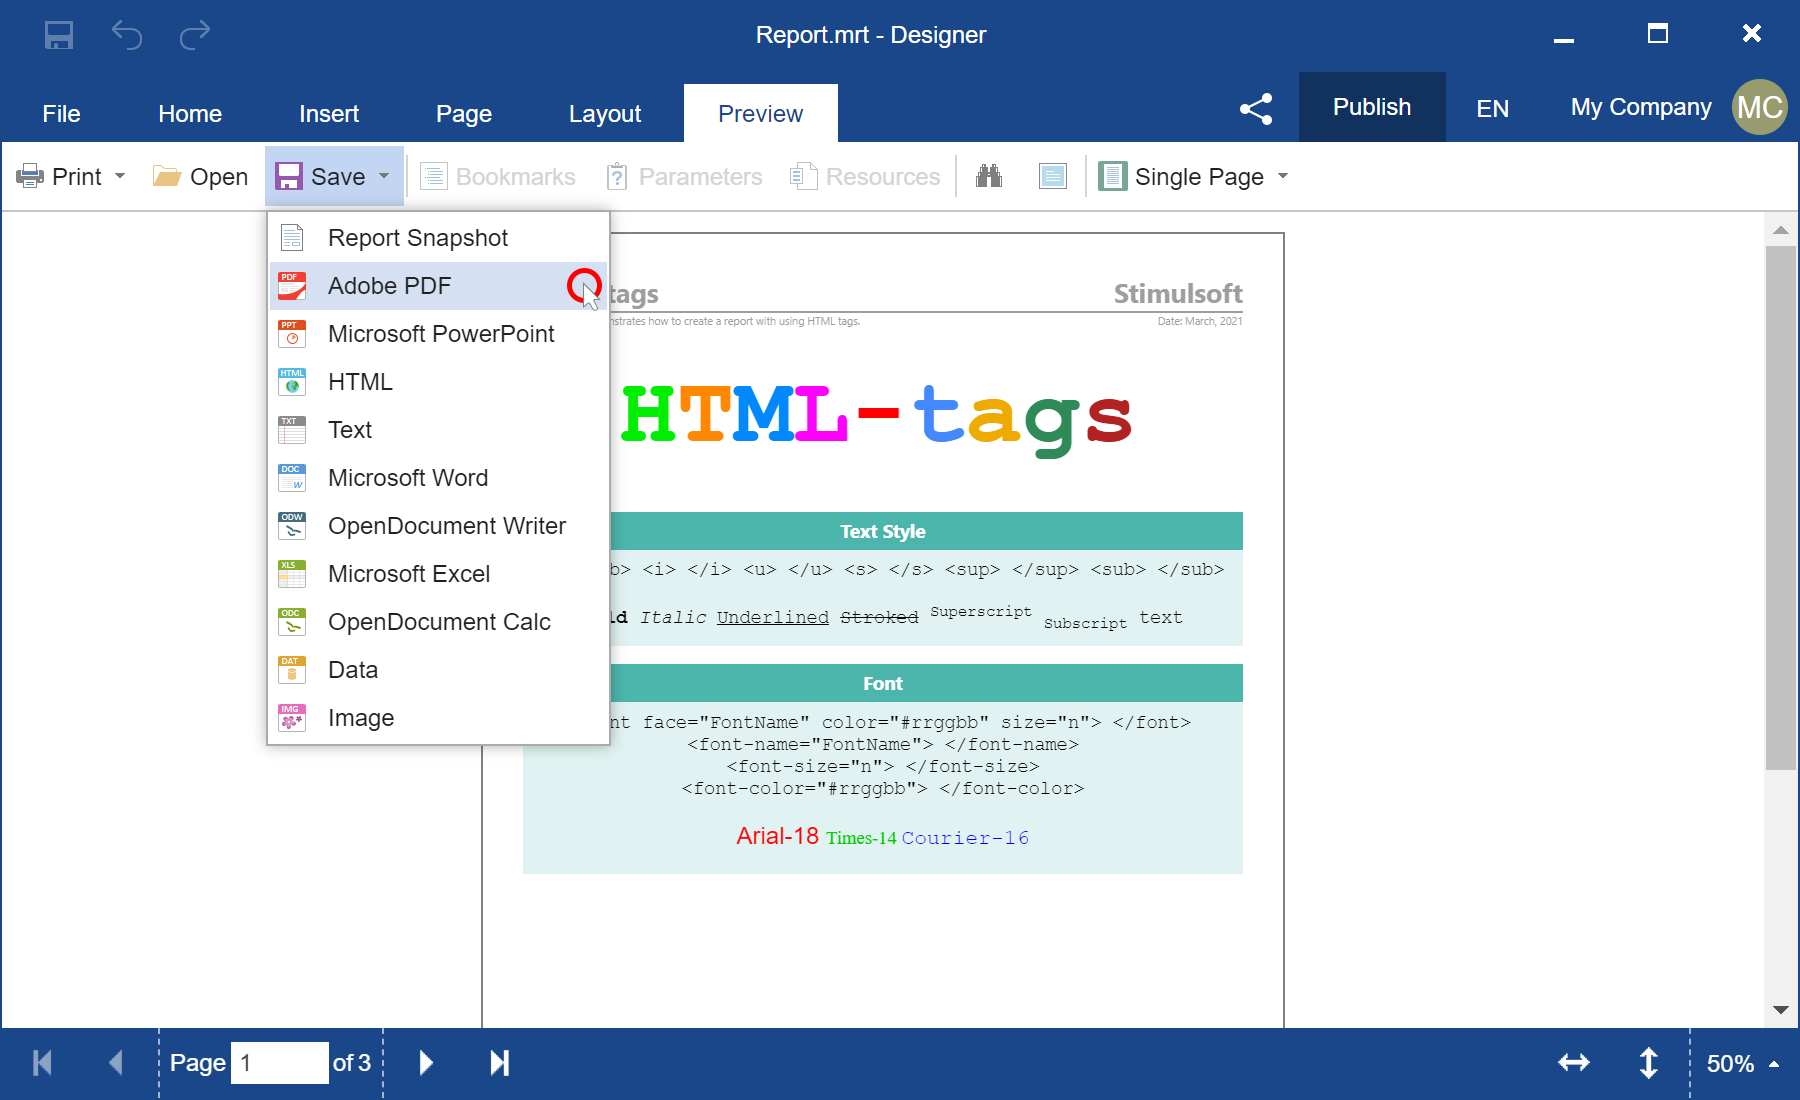
We have improved the algorithm for exporting reports and dashboards to a PDF file for JS and .NET Core components. Previously, HTML tags were processed, converted into an image or cut out for a PDF file. Now HTML tags are supported in PDF files when exporting reports and dashboards.
Exporting dashboards to SVG
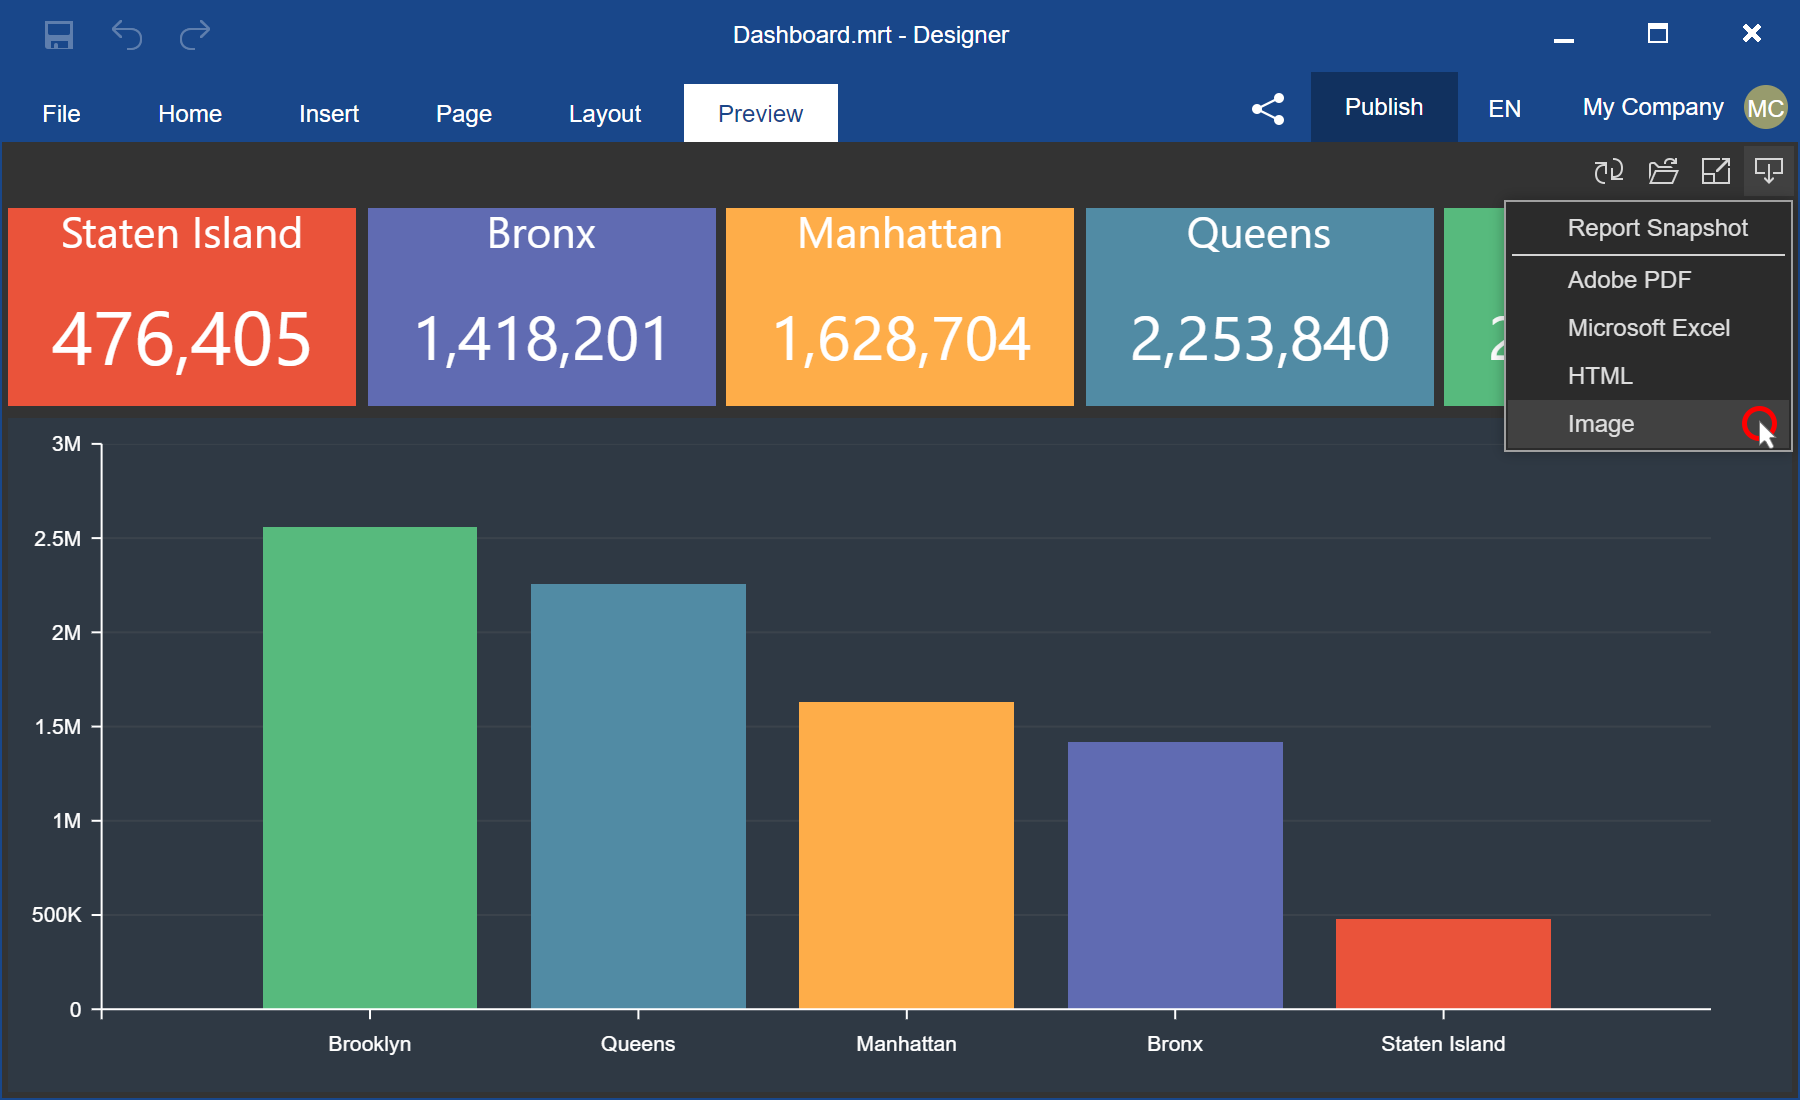
Also, we have added the ability to export dashboards and their elements to an SVG file for Dashboards.JS. While viewing the dashboard, select the Image command from the Save menu on the toolbar or similar menu for a specific item. After that, the dashboard or its element will be converted into an SVG file.
Exporting reports to PowerPoint
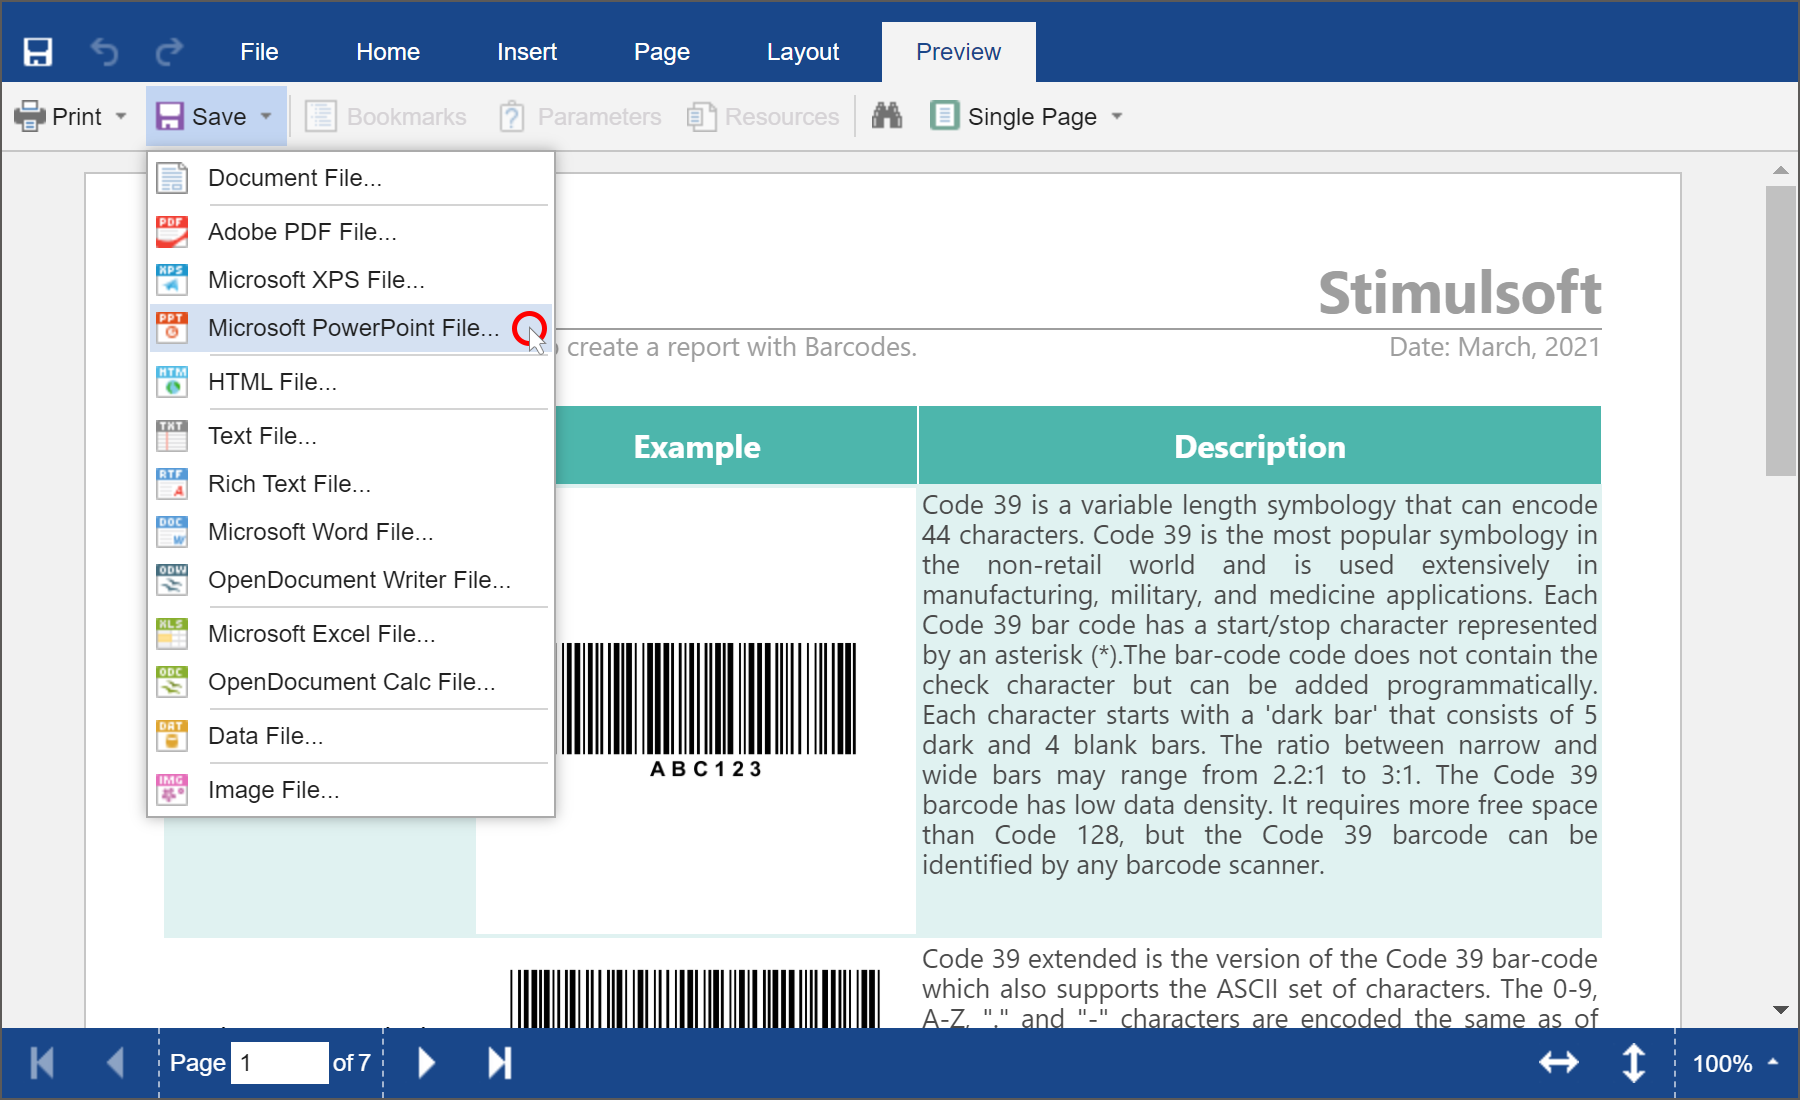
Now in Reports.Java, you may export reports to Microsoft PowerPoint (*.pptx). While viewing the report, select the Microsoft PowerPoint file command from the Save menu, specify the export option, and click the OK button in the export settings menu. The report will be converted to Microsoft PowerPoint.
Support for Blazor
Starting with the 2021.2 release, we are introducing the reporting tool for the Blazor platform. It is a cross-platform software designed for integration into applications using the Blazor framework. Our components support Razor Pages technology. They may work both on the server-side (Blazor Server) and client-side (Blazor WebAssembly). All you need is a Web browser. This report writer is part of Stimulsoft Reports.Web.

Mathematical formulas
In the new version, you can insert math formulas in your reports using the special Math Formula component. All mathematical formulas are arranged in groups in the special editor, where each group can be found on a separate tab. Also, you can specify the formula using LaTeX syntax.

New data adapters - Azure SQL and Azure Blob Storage
In this new release, we have added new adapters to fetch data from services such as Azure SQL and Azure Blob Storage. You may find them on a separate Azure tab in the New Data Source window. Based on the data obtained from these services, you can create reports and dashboards.

Dashboard positioning
Starting with this release, you can define the behavior of the dashboard when viewed. Previously, you could stretch the dashboard to the entire area of the viewer by height and width. Now you may extend it only by the width, height and width for the whole area of the viewer or not to stretch it at all. To specify the behavior of the dashboard, open the Dashboard settings window and set the value of the Content Alignment parameter. Double-click the workspace or select the Design command from the dashboard context menu to call the dashboard settings.

Export a dashboard to HTML
In this release, we have added the ability to convert the dashboard and its elements to an HTML file. Open the dashboard in the viewer, go to the preview and select the HTML command from the Save menu on the toolbar or in a similar menu for a specific element. After that, the dashboard or its element will be converted into an HTML file.

New variable features
In this release, we have significantly optimized and improved the capabilities of report variables. You may customize the globalization of variable elements in the Globalization Strings editor. And when creating or editing a variable with the Request from User option enabled, you can specify the sorting of the values of this variable in the viewer. Moreover, sorting can be carried out both by the key values of the variable and by signatures. Also, in reports, you can refer to the signatures of variable values using the following template - VariableName.Label.

Digital signature certificate
In the 2021.2 release, we simplified the digital signature certificate selection directly from the export settings menu when converting a report to PDF. Click the Browse button in the Digital Signature field and select a certificate.

The new dashboard feature - Percent Of Grand Total
We have added a new function Percent Of Grand Total for the Measure type of dashboard elements. You may use the new function to display the fraction of the current value from the sum of the values of this data field. To show percentages, apply percentage formatting to the field where values are processed using the Percent Of Grand Total function.

Support for HTML tags in PDF
We have improved the algorithm for exporting reports and dashboards to a PDF file for JS and .NET Core components. Previously, HTML tags were processed, converted into an image or cut out for a PDF file. Now HTML tags are supported in PDF files when exporting reports and dashboards.

Exporting dashboards to SVG
Also, we have added the ability to export dashboards and their elements to an SVG file for Dashboards.JS. While viewing the dashboard, select the Image command from the Save menu on the toolbar or similar menu for a specific item. After that, the dashboard or its element will be converted into an SVG file.

Exporting reports to PowerPoint
Now in Reports.Java, you may export reports to Microsoft PowerPoint (*.pptx). While viewing the report, select the Microsoft PowerPoint file command from the Save menu, specify the export option, and click the OK button in the export settings menu. The report will be converted to Microsoft PowerPoint.


