We are pleased to announce the release of the new version Stimulsoft Reports and Dashboards 2019.4 which is now available for download. This major release comes with the number of changes including the new installer, support for custom maps, HiDPI support, and critical fix with printing in Chrome77.
New installer
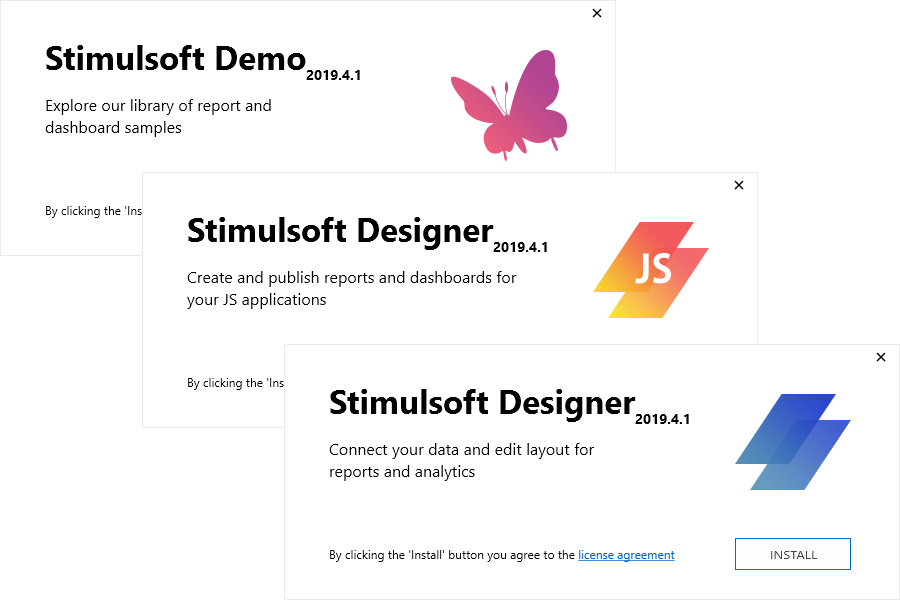
Starting with the release of 2019.4, you can install each Stimulsoft application as a separate distribution. Previously, to run the report designer, you had to download a Stimulsoft product entirely, install it, and then start designing reports and dashboards. Now, to begin creating reports and dashboards, install Stimulsoft Designer in the Windows operating system or Stimulsoft Designer.JS in the Windows and macOS operating systems.
You can also download the Stimulsoft Demo to familiarize yourself with our sample reports and dashboards. Also, you can download product packages from the website, in your account, from NuGet, npm, Maven file storages, or from the report designer dialog.
Printing reports from a web browser
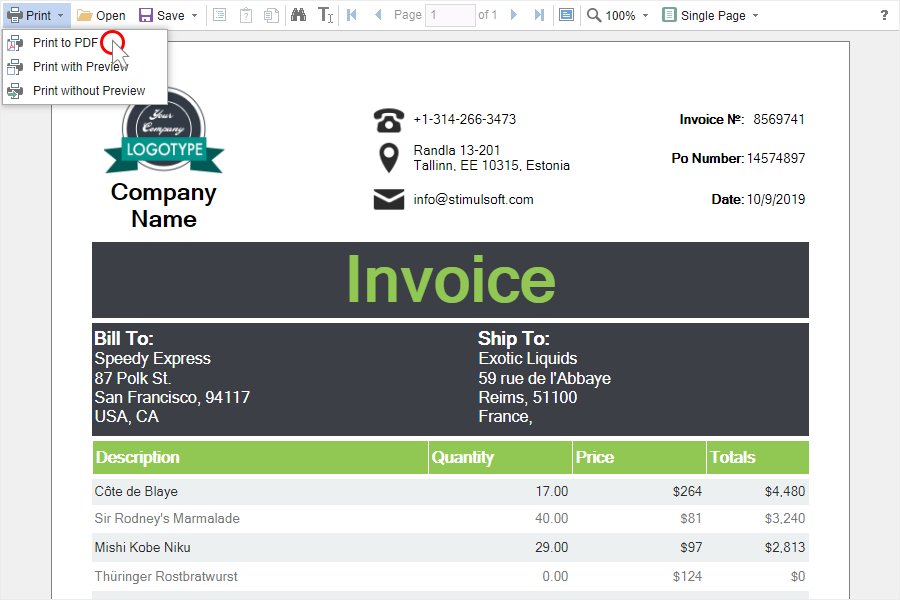
In Google Chrome browser version 77, changes were made to the built-in PDF document viewer, because of which the automatic printing of the report from the menu of the Web viewer stopped working. We analyzed the situation and found a solution. In the new version of the product, report printing works correctly in any browser, on any operating system.
New CosmosDB Data Adapter
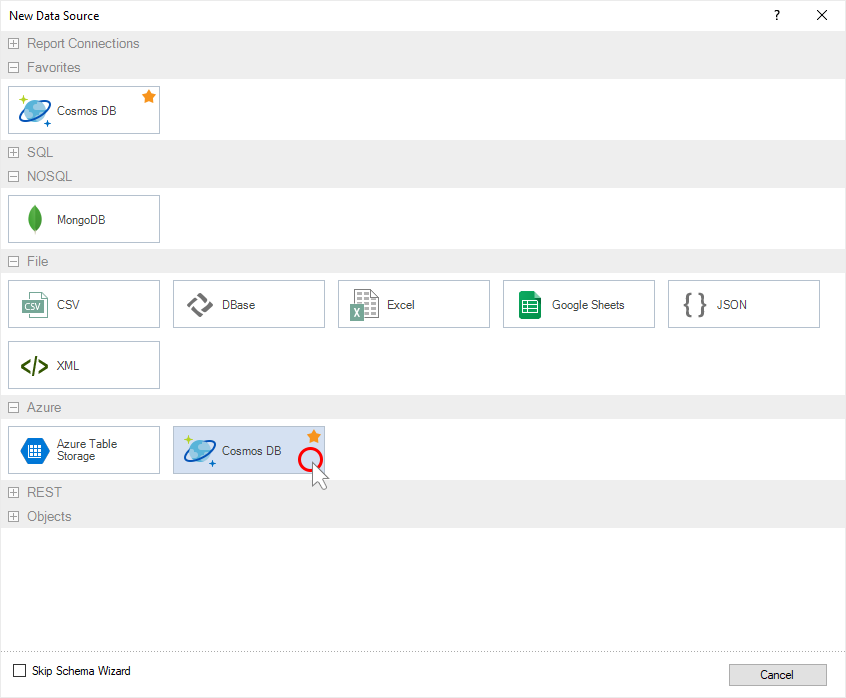
You can now retrieve data using the Azure CosmosDB server. To do this, select the CosmosDB type in the window for creating a data source and specify the connection string. After retrieving the data, you can design reports and dashboards based on them.
HiDPI support
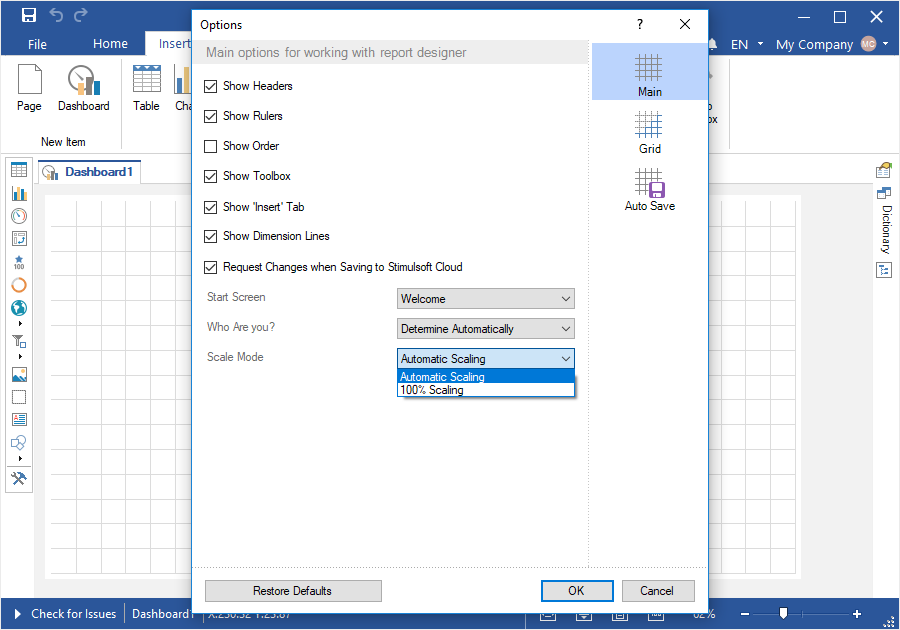
The 2019.4 release adds HiDPI support in the standalone report designer. The designer automatically adapts to the scaling set in the system. You can define a scaling mode of 100 percent in the report designer settings. By default, the automatic zoom mode is used.
The Get Started window
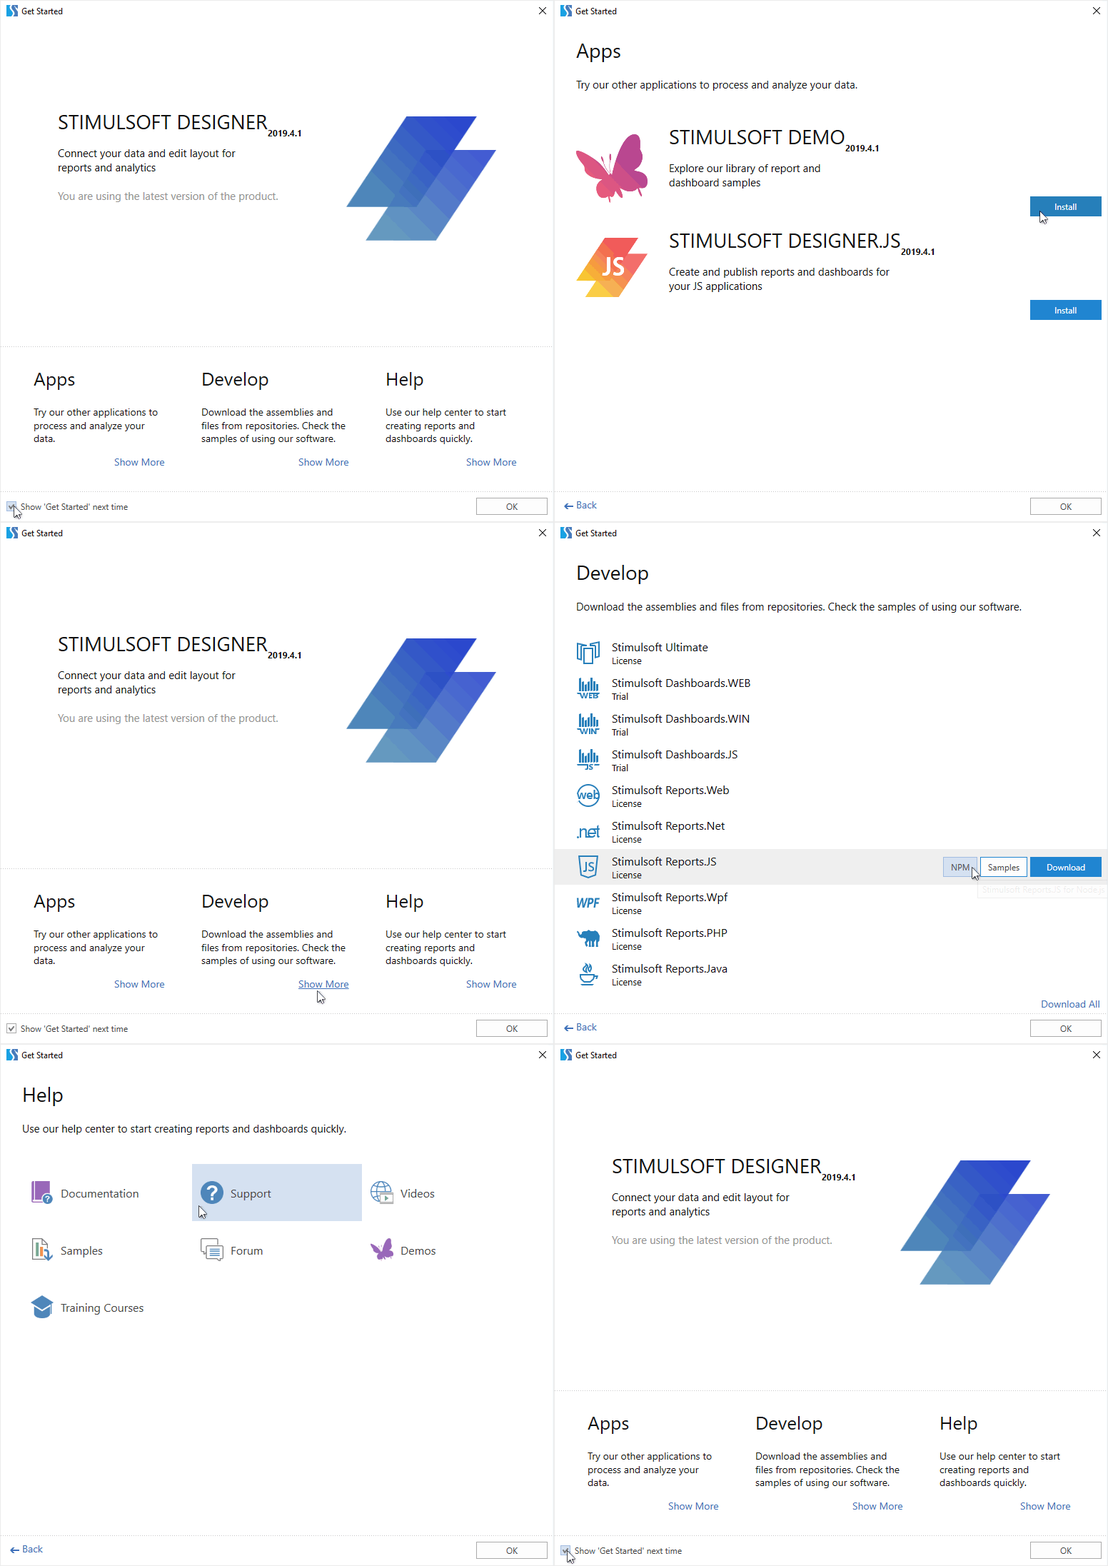
When you run the report designer first time, you will see the Get Started window. From there, you can download and get access to other Stimulsoft applications, development packages, or help resources. You can disable popping up this window at every start of the designer. Just uncheck the
"Show 'Get Started' next time" option. You can call this window from the report designer by selecting the Get Started command from the File menu.
Sorting for dashboard elements
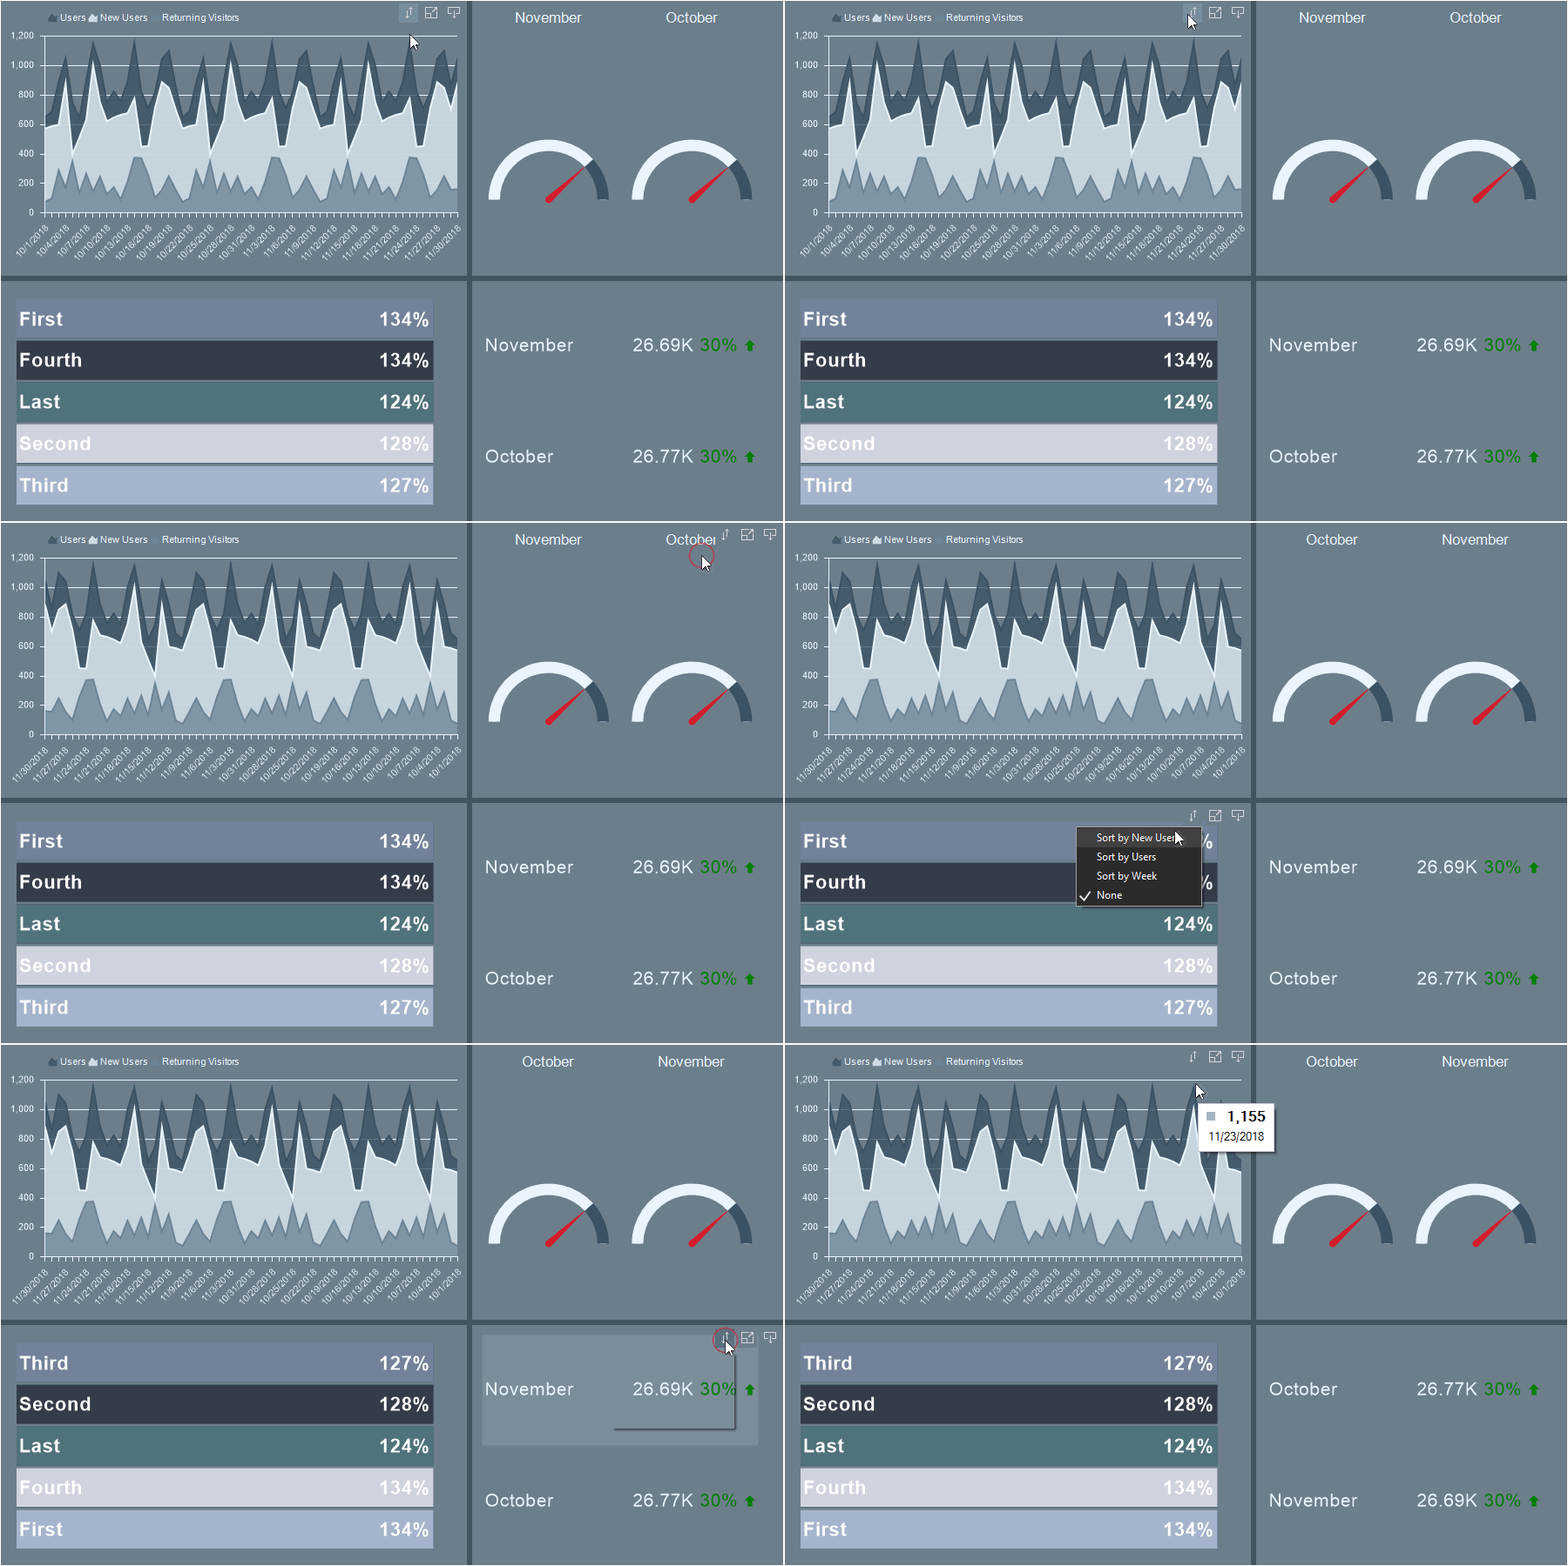
In the release 2019.4, you can specify the sorting of data for elements of the dashboards – Chart, Progress, Indicator, Gauge. You may change sorting data from the report designer or in the viewer. To do this, hover over an item, click the sort button, select a data field, and set the sorting direction. Sort settings apply only to the current element.
New chart functionality
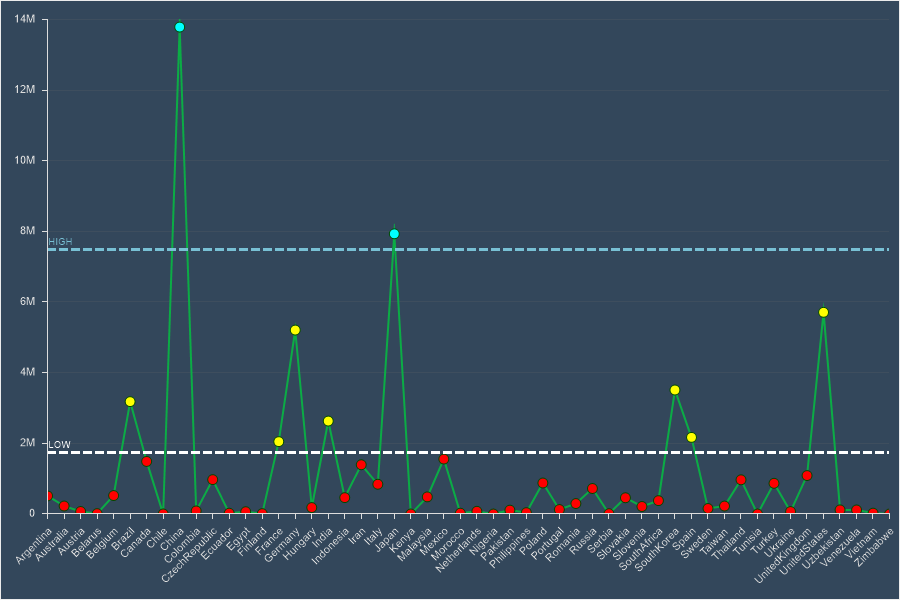
In the new version, we added new features for the chart in dashboards. Now you can use Constant Lines, Markers, and Labels for values. To use the new features, you should select the Chart element and use the properties to determine their settings. Also, we added the conditional formatting of values for the chart. Thus, using markers, constant lines, and conditional formatting, you can create control charts.
Conditional formatting in dashboards
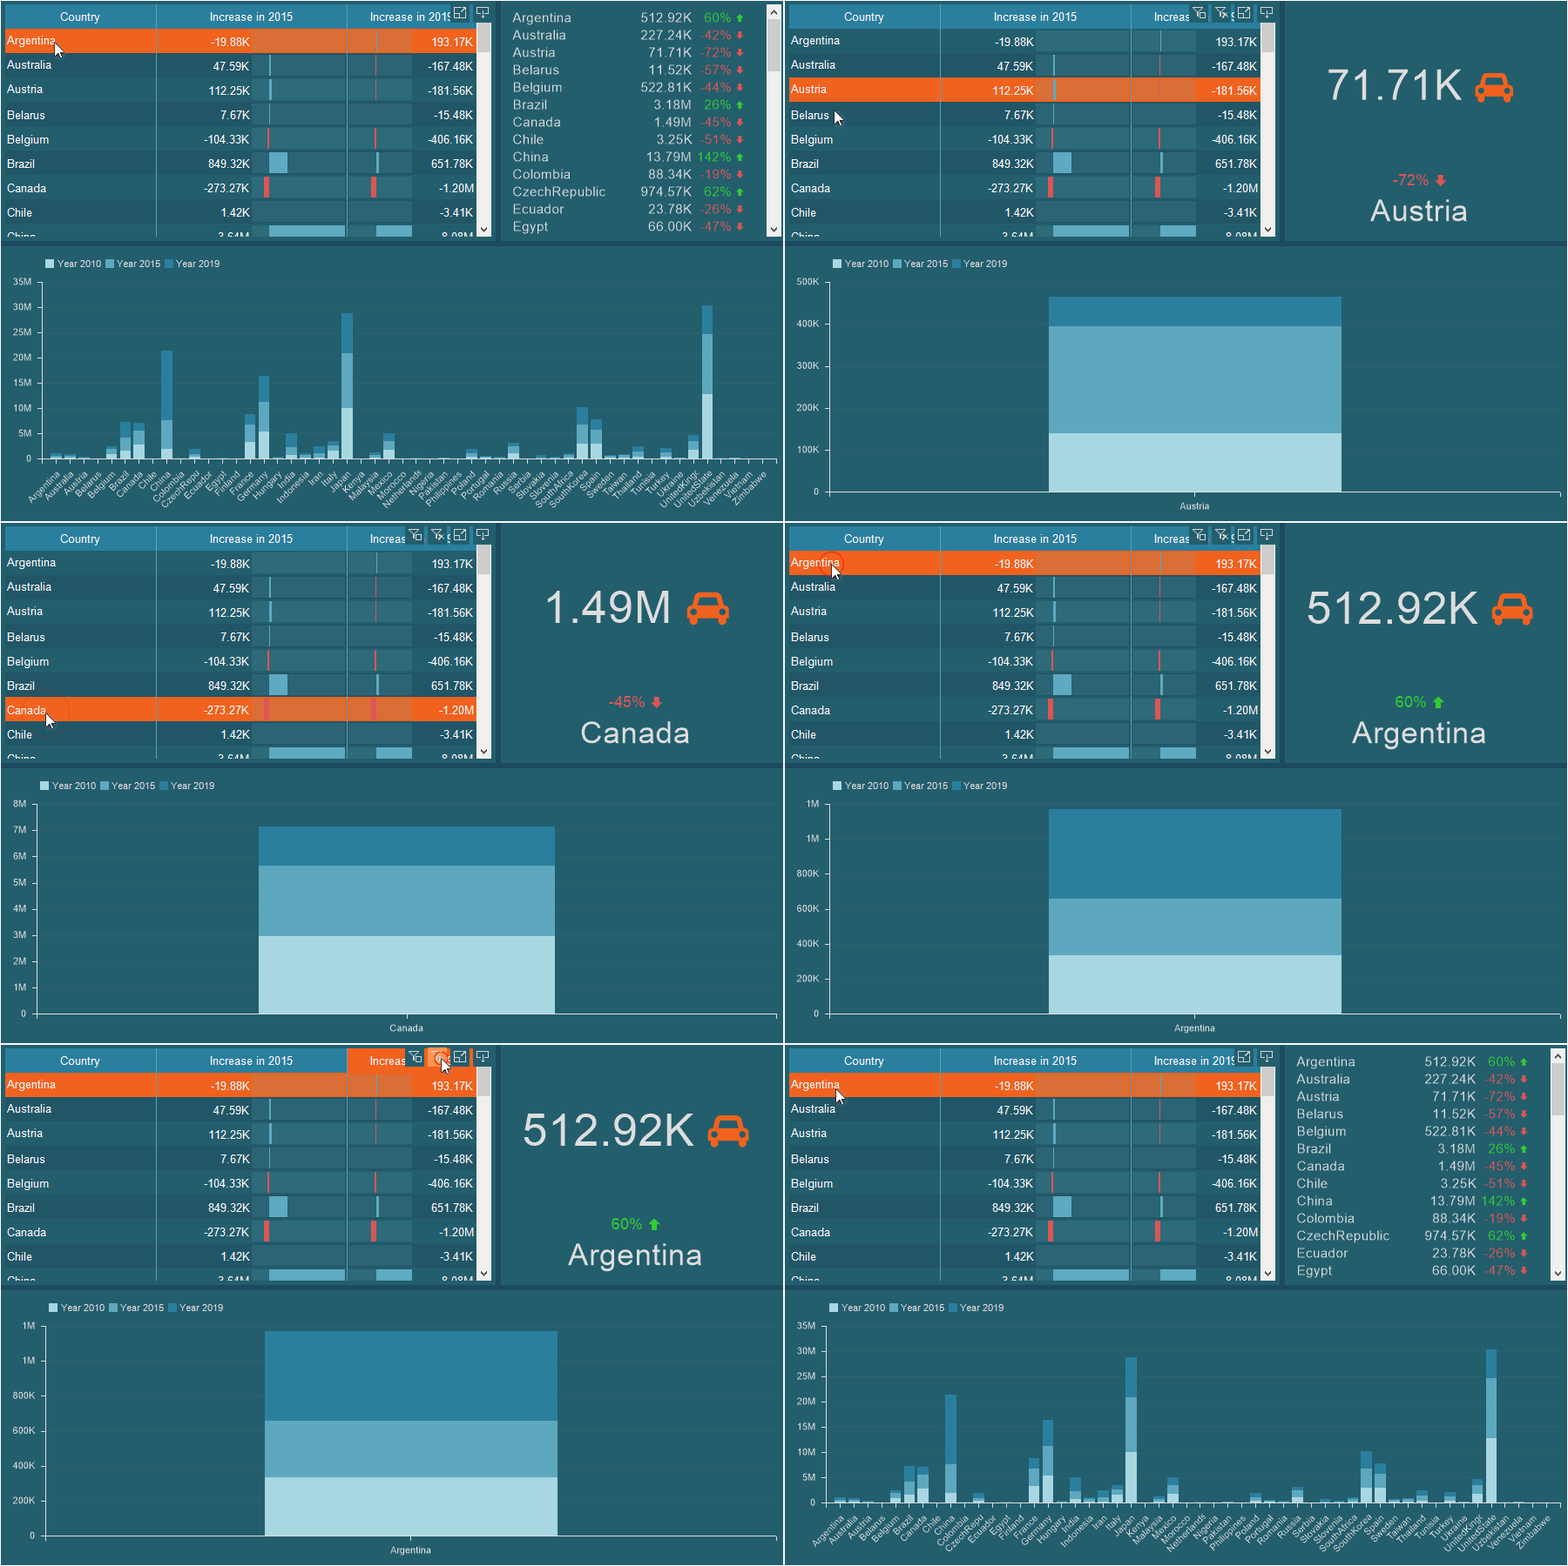
We added the ability to conditionally format dashboards elements – Indicator, Pivot Table, and Chart. Using conditional formatting, you can change the design settings of an element. To configure conditional formatting of an element, select the element in the dashboard and click the Conditions button on the Home tab of the Ribbon panel of the report designer. Add a condition and define conditional formatting options for the Pivot table.
New features of the Table element
We have added new functions for the Table element of dashboards. Now you can enable the display of totals in a column, select a table row, disable the detail mode of the table data when applying a filter. The settings for displaying totals are carried out in the editor of the Table element and enabling the row selection mode, and the disabling of the drill-down mode in the editor is the interaction of the current item.
New online map features
Now, when you create dashboards with an online map, you can display a chart of values or display an icon for values on this map. To change the display mode of the value on the online map, select the appropriate value of the View Mode parameter in the editor of the current element. To display a value chart, you should also specify a data field in the Arguments field. Also, in the current release, the online map supports a dark style. The style of the map depends on the style of the dashboard panel.
Custom maps
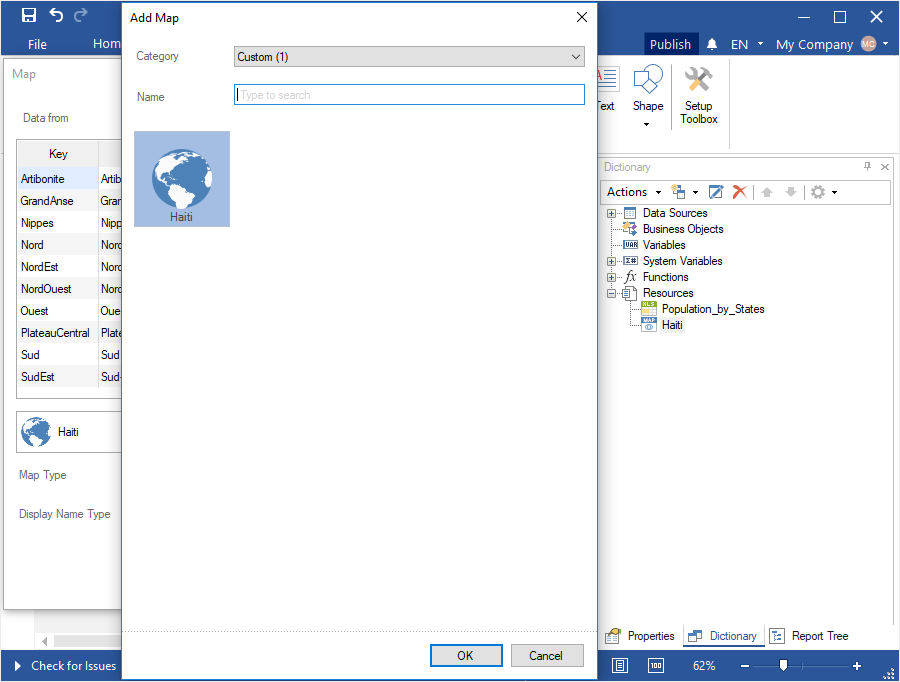
In the new version, you can use custom maps in reports and dashboards. To do this, you should create a map file and add this file to the report resources. After that, the map will be displayed in the map list of the Region Map element in dashboards or the Map component in reports. Select a custom map in the element (or component) editor and set values for the geographic objects of this map. Also, we improved the map selection window. Now you can select a category for a geographic region or use the search bar. Besides, in the current release, we added new types of maps - Scandinavia, Benelux countries and updated maps of Europe and the European Union.
New functionality for Image and Text
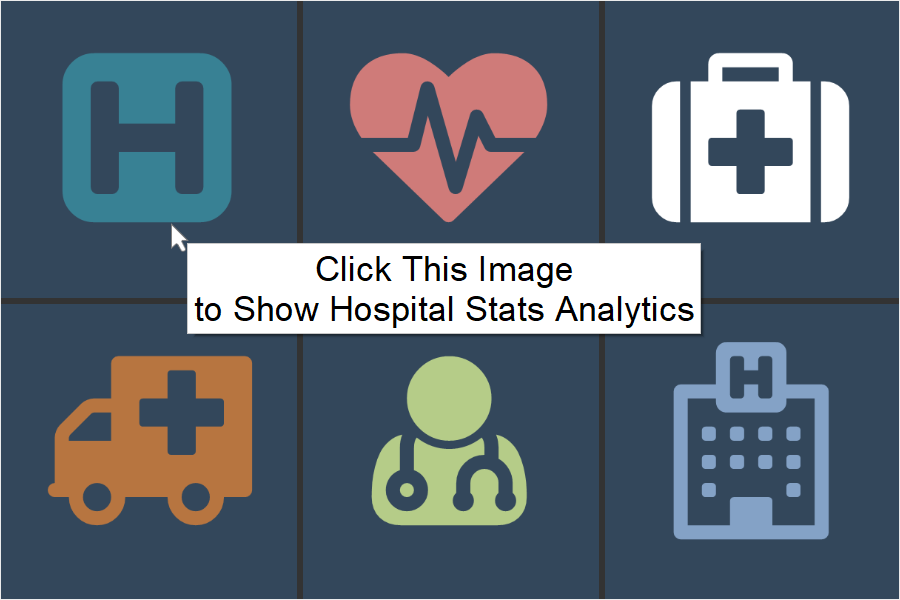
In the release 2019.4, we added new features for the Image and Text elements in dashboards. Now you can use the icons in the Image element. When you click on an image or text, you can open a hyperlink, display a drill-down dashboard panel, and when you hover over these elements, you may see tooltips. The Image component now can save previously loaded images.
Limit rows
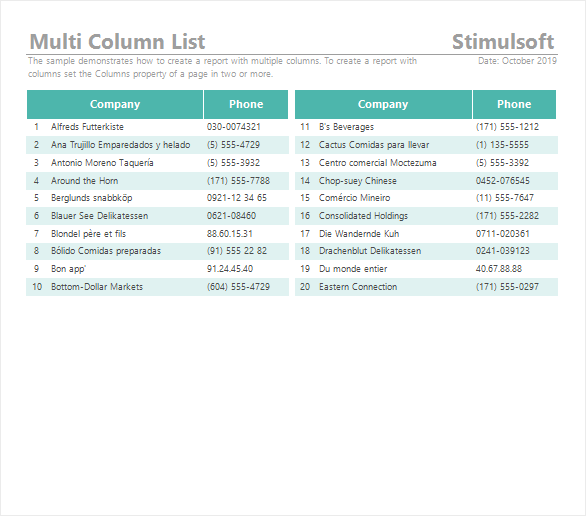
When you create reports, you can specify the row limit for the Data Band on the current page or in the current column. The number of rows of the data band is determined by the numeric value for the Limit Rows property of this band.
Library version in the Publish wizard
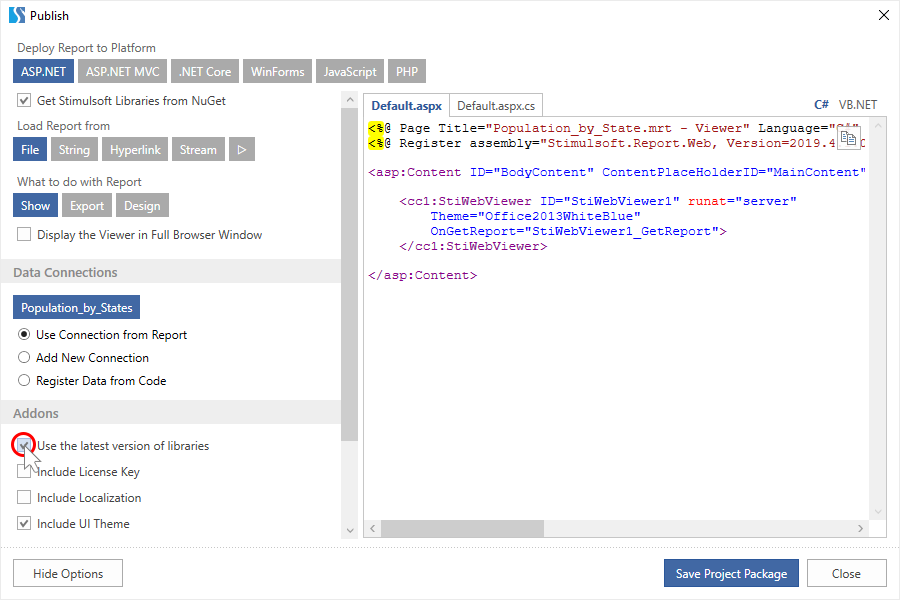
When publishing a report or a dashboard, you can use the latest libraries or the current ones. To use the latest libraries, select the Use the latest versions of libraries option in the publication wizard. If this option is disabled, then when publishing a report or a dashboard, the current version of libraries will be used.
Support for CSV connections in the Publish wizard
Now when publishing reports and dashboards, you can specify a CSV data connection.
Export to Text
In the version 2019.4, in Reports.JS, we added the ability to convert a report to a .txt file. To do this, click the Save button and select the Text file... command in the viewer or the preview panel. After that, define the export settings and click the Ok button.
Support for ZUGFeRD v2.0
In our previous 2016.2 release, we added support for the ZUGFeRD electronic invoice format when exporting reports to PDF. The current version adds support for a new specification of this format - ZUGFeRD v2.0.
Displaying filters on dashboard elements
When viewing the dashboard, some elements are interactive. When you select a value, the data of all related items are filtered. Now, when using this type of filtering, the filter, and the selected value will be displayed on the element.
Compression when exporting to PDF
When you export reports to PDF from Reports.Java or Reports.JS, compression of the finished document is now available. When you export big reports, the size of the PDF document will be significantly reduced.
Data from other data sources in dashboards
When you design dashboards, you can now use data from other data sources. Create a virtual data source and design dashboards and reports based on it.
New installer
Starting with the release of 2019.4, you can install each Stimulsoft application as a separate distribution. Previously, to run the report designer, you had to download a Stimulsoft product entirely, install it, and then start designing reports and dashboards. Now, to begin creating reports and dashboards, install Stimulsoft Designer in the Windows operating system or Stimulsoft Designer.JS in the Windows and macOS operating systems.
You can also download the Stimulsoft Demo to familiarize yourself with our sample reports and dashboards. Also, you can download product packages from the website, in your account, from NuGet, npm, Maven file storages, or from the report designer dialog.

Printing reports from a web browser
In Google Chrome browser version 77, changes were made to the built-in PDF document viewer, because of which the automatic printing of the report from the menu of the Web viewer stopped working. We analyzed the situation and found a solution. In the new version of the product, report printing works correctly in any browser, on any operating system.

New CosmosDB Data Adapter
You can now retrieve data using the Azure CosmosDB server. To do this, select the CosmosDB type in the window for creating a data source and specify the connection string. After retrieving the data, you can design reports and dashboards based on them.

HiDPI support
The 2019.4 release adds HiDPI support in the standalone report designer. The designer automatically adapts to the scaling set in the system. You can define a scaling mode of 100 percent in the report designer settings. By default, the automatic zoom mode is used.

The Get Started window
When you run the report designer first time, you will see the Get Started window. From there, you can download and get access to other Stimulsoft applications, development packages, or help resources. You can disable popping up this window at every start of the designer. Just uncheck the
"Show 'Get Started' next time" option. You can call this window from the report designer by selecting the Get Started command from the File menu.

Sorting for dashboard elements
In the release 2019.4, you can specify the sorting of data for elements of the dashboards – Chart, Progress, Indicator, Gauge. You may change sorting data from the report designer or in the viewer. To do this, hover over an item, click the sort button, select a data field, and set the sorting direction. Sort settings apply only to the current element.

New chart functionality
In the new version, we added new features for the chart in dashboards. Now you can use Constant Lines, Markers, and Labels for values. To use the new features, you should select the Chart element and use the properties to determine their settings. Also, we added the conditional formatting of values for the chart. Thus, using markers, constant lines, and conditional formatting, you can create control charts.

Conditional formatting in dashboards
We added the ability to conditionally format dashboards elements – Indicator, Pivot Table, and Chart. Using conditional formatting, you can change the design settings of an element. To configure conditional formatting of an element, select the element in the dashboard and click the Conditions button on the Home tab of the Ribbon panel of the report designer. Add a condition and define conditional formatting options for the Pivot table.
New features of the Table element
We have added new functions for the Table element of dashboards. Now you can enable the display of totals in a column, select a table row, disable the detail mode of the table data when applying a filter. The settings for displaying totals are carried out in the editor of the Table element and enabling the row selection mode, and the disabling of the drill-down mode in the editor is the interaction of the current item.

New online map features
Now, when you create dashboards with an online map, you can display a chart of values or display an icon for values on this map. To change the display mode of the value on the online map, select the appropriate value of the View Mode parameter in the editor of the current element. To display a value chart, you should also specify a data field in the Arguments field. Also, in the current release, the online map supports a dark style. The style of the map depends on the style of the dashboard panel.
Custom maps
In the new version, you can use custom maps in reports and dashboards. To do this, you should create a map file and add this file to the report resources. After that, the map will be displayed in the map list of the Region Map element in dashboards or the Map component in reports. Select a custom map in the element (or component) editor and set values for the geographic objects of this map. Also, we improved the map selection window. Now you can select a category for a geographic region or use the search bar. Besides, in the current release, we added new types of maps - Scandinavia, Benelux countries and updated maps of Europe and the European Union.

New functionality for Image and Text
In the release 2019.4, we added new features for the Image and Text elements in dashboards. Now you can use the icons in the Image element. When you click on an image or text, you can open a hyperlink, display a drill-down dashboard panel, and when you hover over these elements, you may see tooltips. The Image component now can save previously loaded images.

Limit rows
When you create reports, you can specify the row limit for the Data Band on the current page or in the current column. The number of rows of the data band is determined by the numeric value for the Limit Rows property of this band.

Library version in the Publish wizard
When publishing a report or a dashboard, you can use the latest libraries or the current ones. To use the latest libraries, select the Use the latest versions of libraries option in the publication wizard. If this option is disabled, then when publishing a report or a dashboard, the current version of libraries will be used.

Support for CSV connections in the Publish wizard
Now when publishing reports and dashboards, you can specify a CSV data connection.
Export to Text
In the version 2019.4, in Reports.JS, we added the ability to convert a report to a .txt file. To do this, click the Save button and select the Text file... command in the viewer or the preview panel. After that, define the export settings and click the Ok button.
Support for ZUGFeRD v2.0
In our previous 2016.2 release, we added support for the ZUGFeRD electronic invoice format when exporting reports to PDF. The current version adds support for a new specification of this format - ZUGFeRD v2.0.
Displaying filters on dashboard elements
When viewing the dashboard, some elements are interactive. When you select a value, the data of all related items are filtered. Now, when using this type of filtering, the filter, and the selected value will be displayed on the element.
Compression when exporting to PDF
When you export reports to PDF from Reports.Java or Reports.JS, compression of the finished document is now available. When you export big reports, the size of the PDF document will be significantly reduced.
Data from other data sources in dashboards
When you design dashboards, you can now use data from other data sources. Create a virtual data source and design dashboards and reports based on it.