We are thrilled to announce the release of version 2025.1 of Stimulsoft products, designed to enhance your experience in creating reports, dashboards, and PDF forms! This latest release brings you lots of improvements and new features to make working with data even more efficient and user-friendly. Highlights include support for .NET 9, a new data adapter for Microsoft Analysis Services, Node.js for PHP and Python in the Publish wizard, an updated variable editor, and much more. Stay tuned and read below about these features and more!




A list of the new features in version 2025.1
- .NET 9 support
- Custom fonts and styles in PHP and Python products
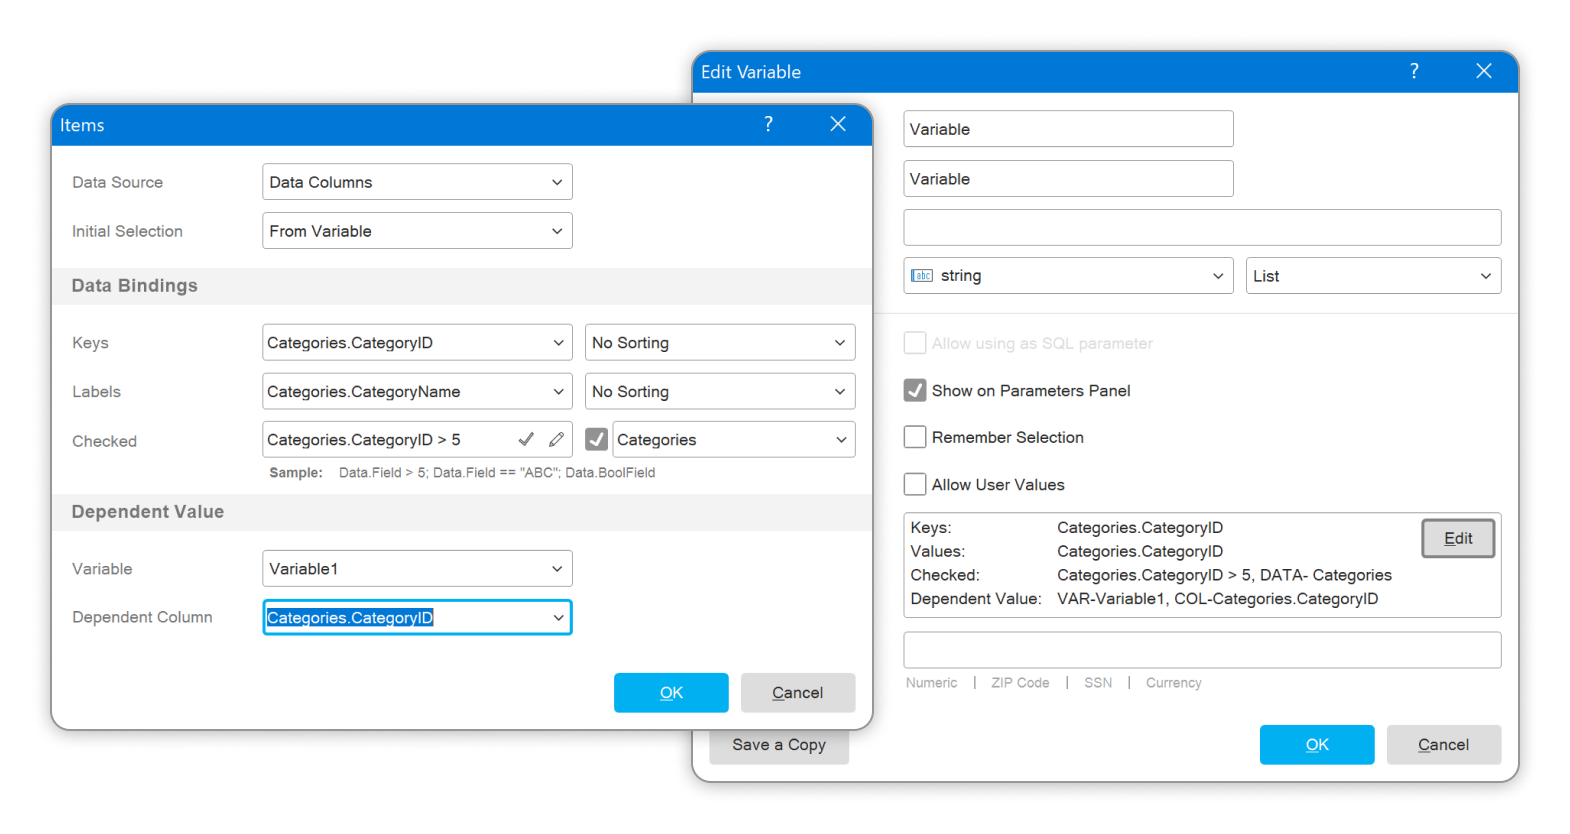
- Updated variable editor
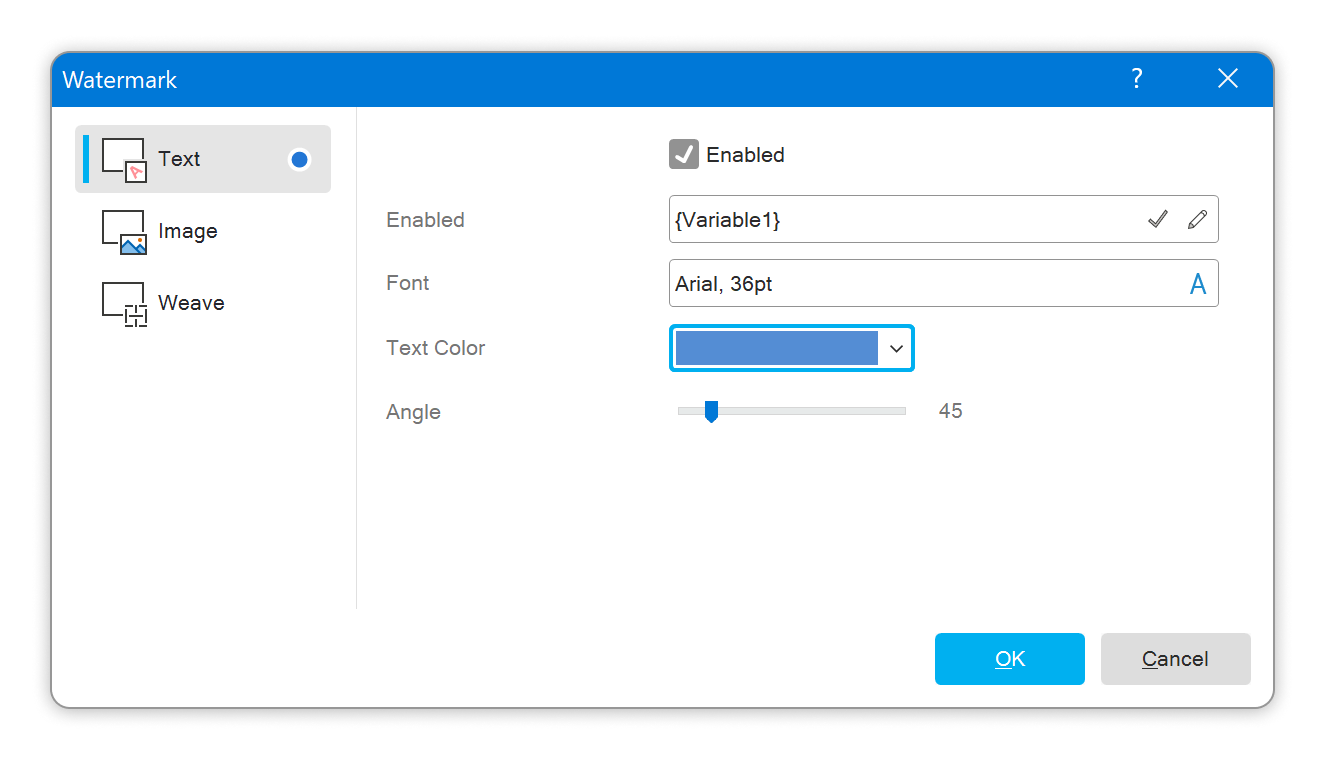
- Expressions in dashboard watermarks
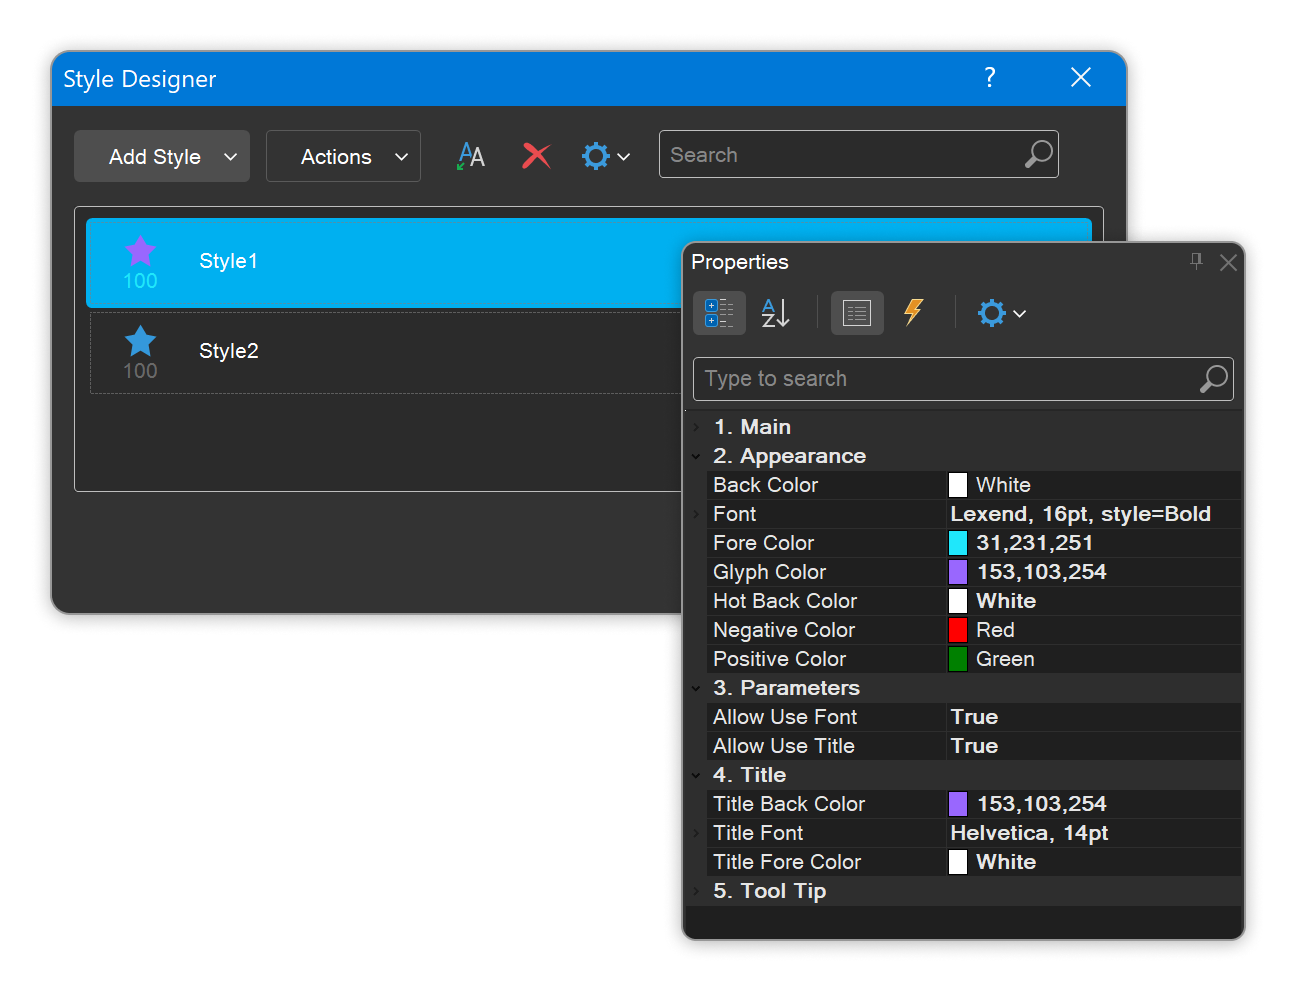
- Title and font settings in dashboard styles
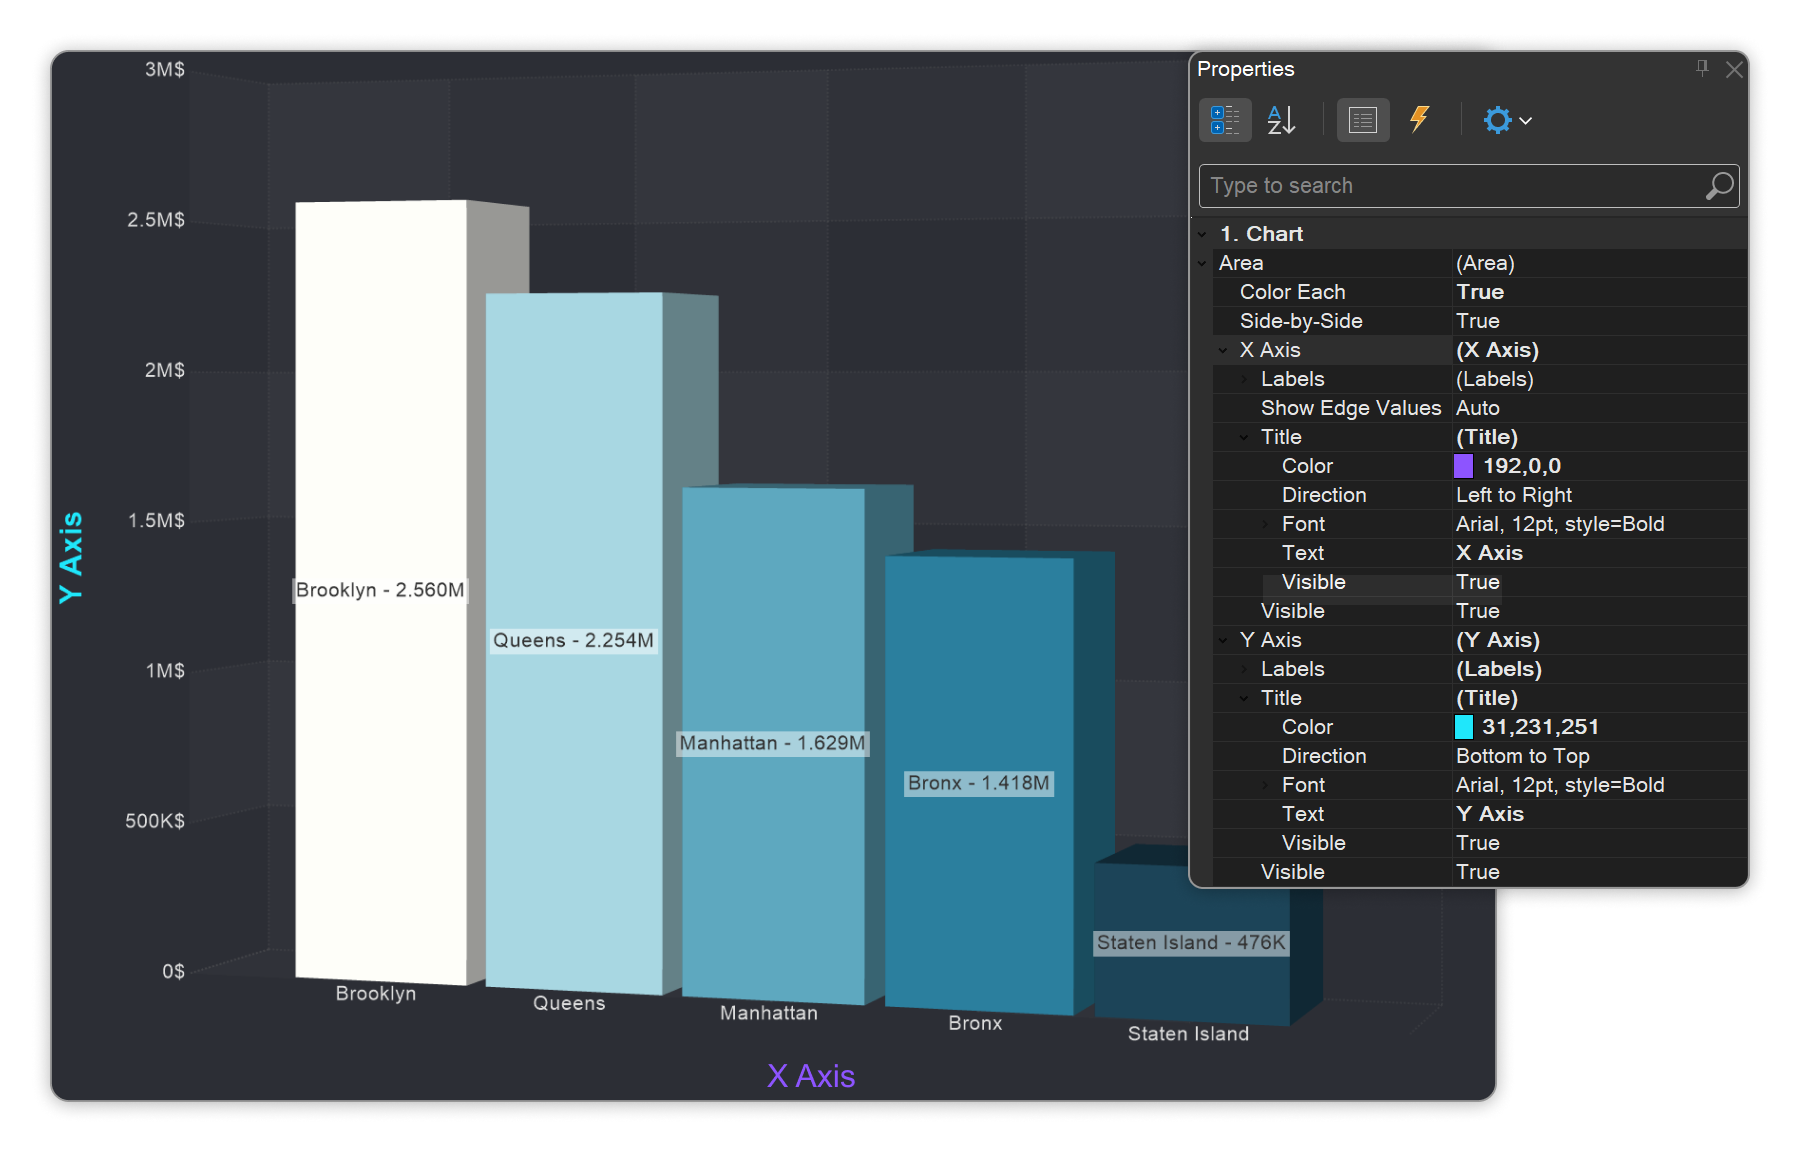
- Axis titles for 3D charts
- Filter mode in tree elements
- Icons in conditional formatting
- Node.js for PHP and Python in the Publish wizard

.NET 9 support
On November 12, 2024, the official launch of the .NET 9.0 framework took place. We tested our components, thoroughly and promptly resolved any identified issues. Starting with version 2024.4.5, all components are fully compatible with the .NET 9 framework. If you experience any issues with the functionality of the components in the new version, we strongly recommend updating to at least version 2024.4.5.
Custom fonts and styles in PHP and Python products
We have added special classes, StiFunctions and StiFontCollection, which allow you to add custom JavaScript functions and upload custom fonts for use in the reporting tool. These added functions and fonts can be integrated into the Report Designer and can be utilized for building reports on both the client side and server side using the Node.js framework.Updated variable editor
The editor for creating and editing report variables has been optimized and updated. The basic improvement involves the configuration of parameters for variable elements, which is now done in a separate window. To configure the list of variable elements, enable the Show on parameter panel option and click the Edit button in the Items field.
Expressions in dashboard watermarks
You can now use expressions in the Text tab when creating a dashboard watermark. The result of evaluating the expression will serve as the text for the watermark. This means you can define a dashboard watermark using Text or Expression, Image, Weave, or a combination of these elements.
Title and font settings in dashboard styles
The Font and Title property groups have been added to styles, allowing you to define the font settings for an element and the element's title parameters. The application of the font and title settings from a style or component properties depends on the values of the following properties in the style: Allow Use Font and Allow Use Title. If these properties are set to True, the settings from the style will be applied. Otherwise, the font and title settings will be determined by the dashboard element properties.
Axis titles for 3D charts
The ability to use a title for the X and Y axes in 3D charts has been added. The axis title can be configured using the Title property group, which is located under Area > X-Axis or Y-Axis > Title.
Filter mode in tree elements
A new Filter Mode parameter has been added when selecting a value in hierarchical filter elements such as Tree View and Tree View Box. This parameter determines whether the filter is applied to dashboard elements based on only the selected value or the selected value with the hierarchy taken into account. The Filter Mode parameter is available only when the Selection Mode parameter is set to One.Icons in conditional formatting
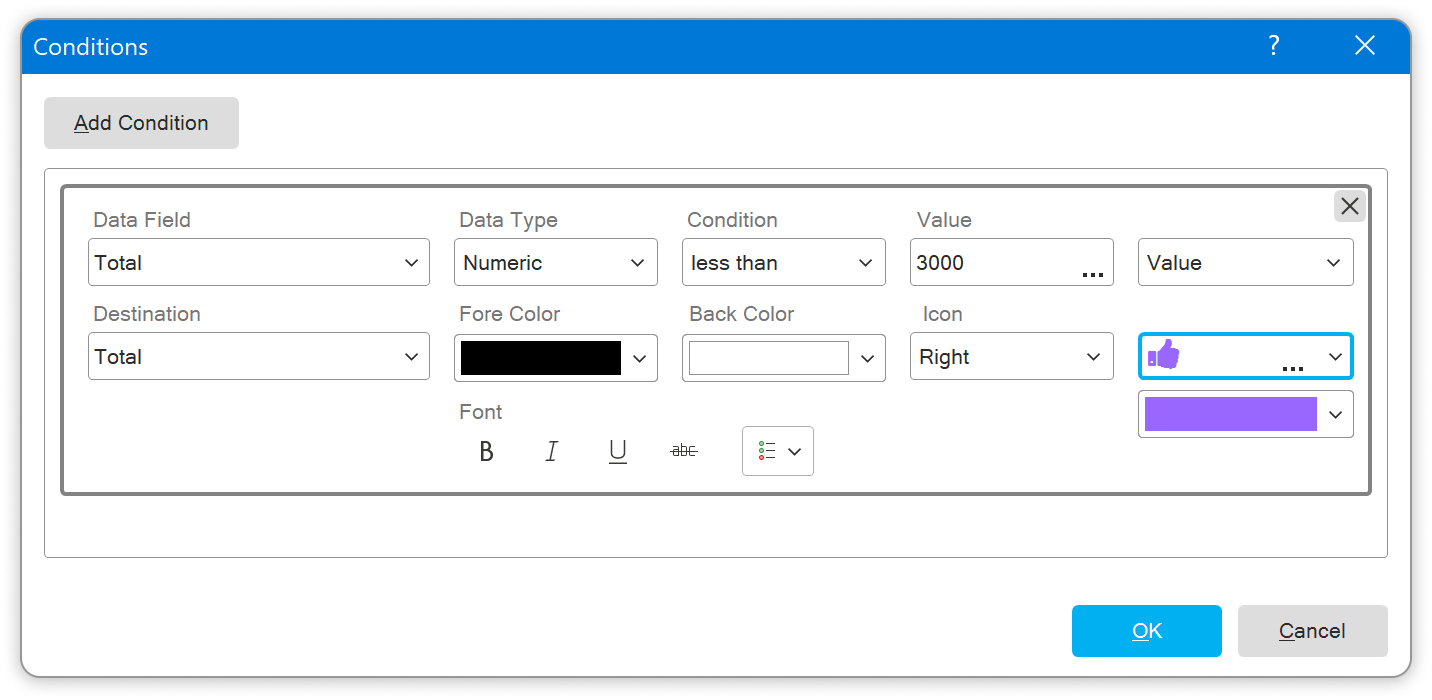
The ability to use icons in conditional formatting for the Table dashboard element has been added. Now, different icons can be applied to the cells of the Table element based on the specified conditions. Additionally, you can use an uploaded image instead of an icon.Node.js for PHP and Python in the Publish wizard
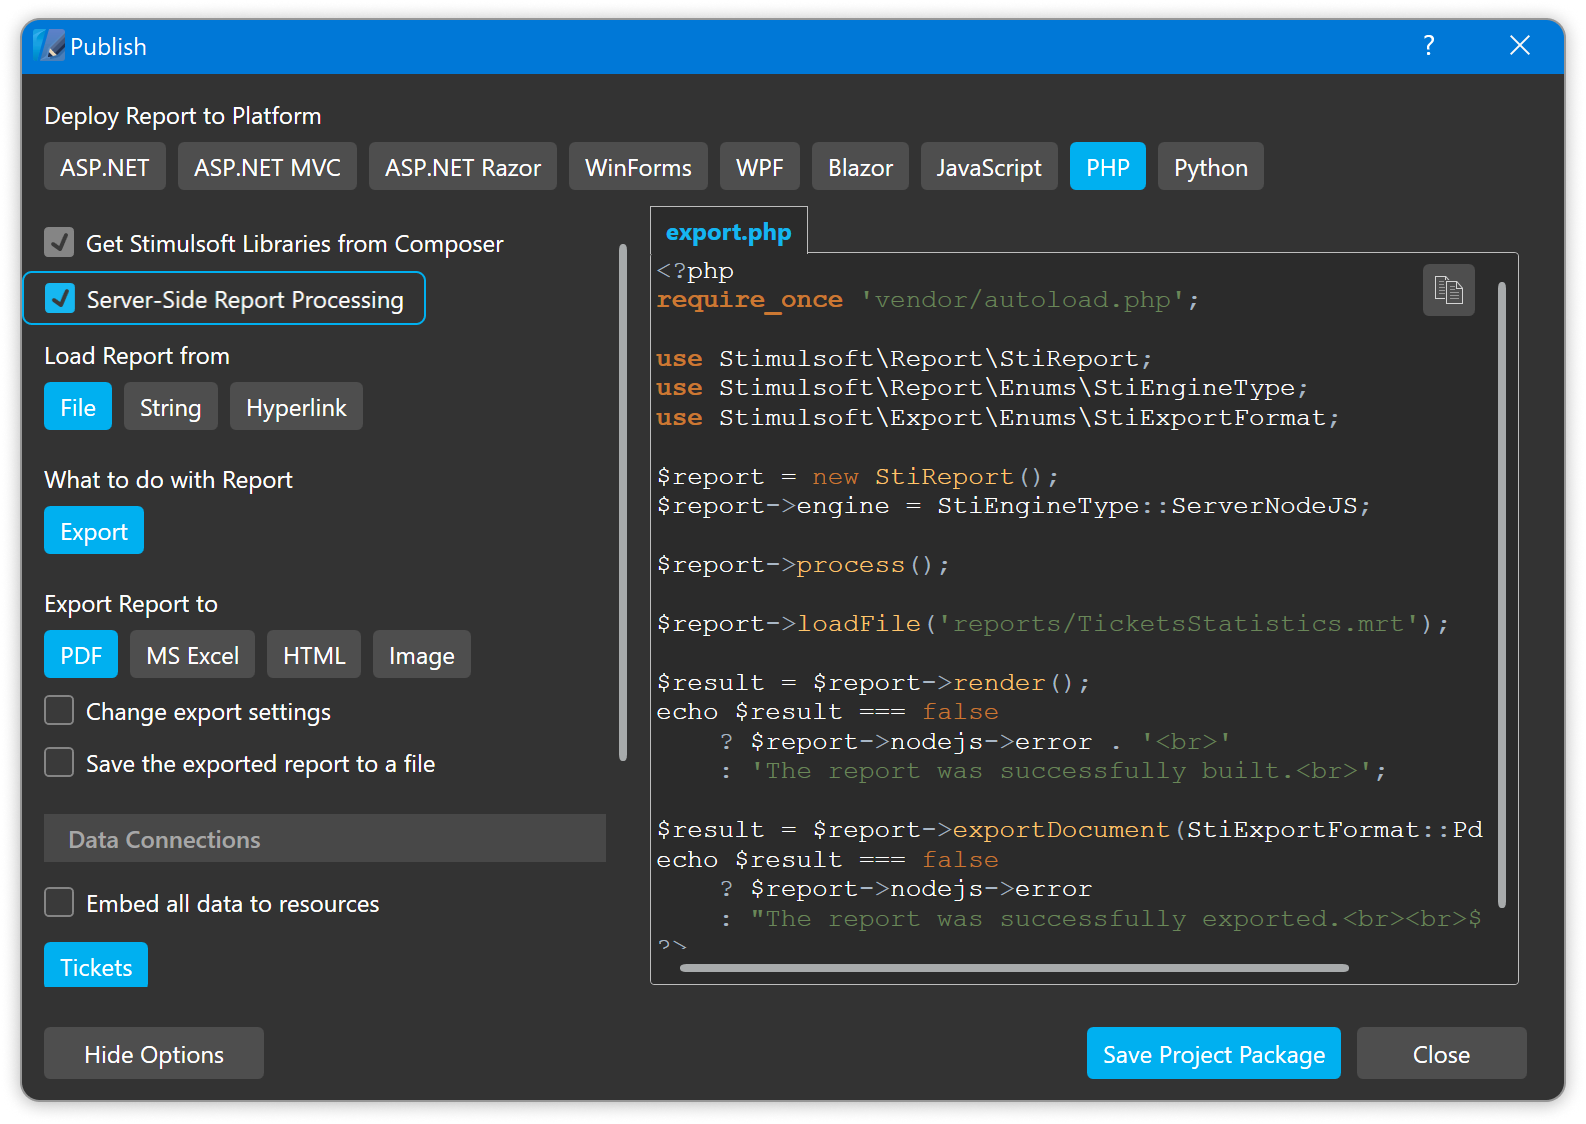
The ability to quickly create a PHP or Python project with server-side report processing has been added to the Publish wizard. The Publish wizard is used for easy and quick integration of Stimulsoft components into third-party projects and solutions.
Swap arguments and values in charts
A Swap control has been added to the Chart component editor. When clicked, this control swaps the columns in the Arguments and Values fields. However, if the chart type includes more than one value field, the Swap button will not be displayed in the editor.Export list settings
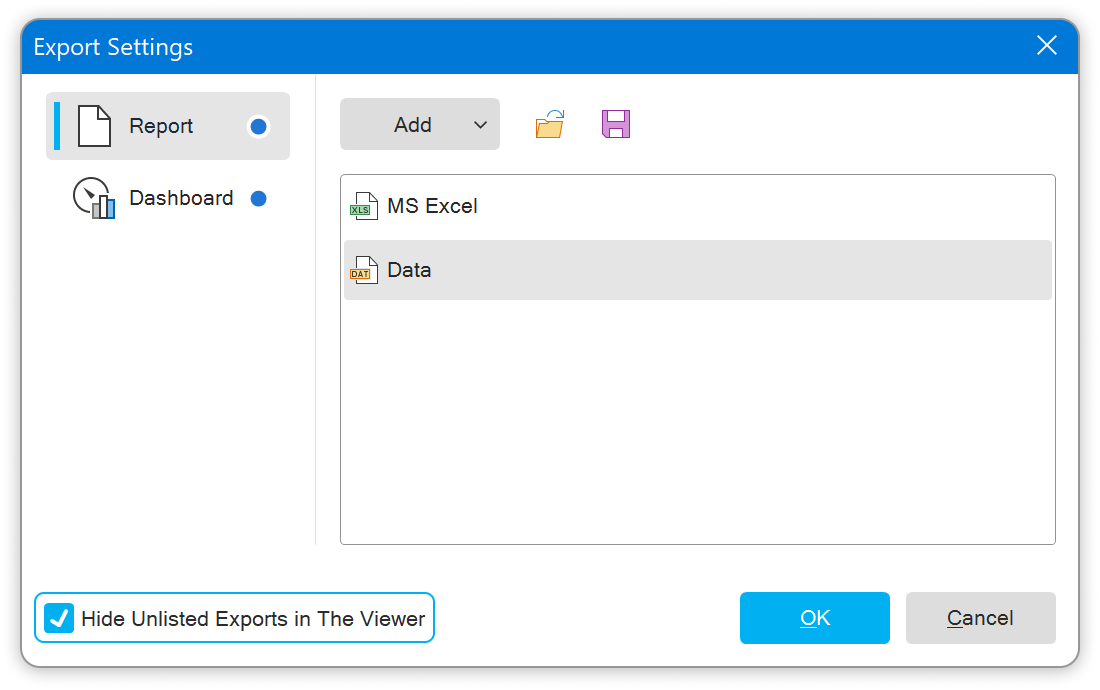
A new Hide Unlisted Exports in The Viewer parameter has been added to the Export Settings editor. This parameter controls the list of available export formats in the Save menu for reports and dashboards. When enabled, only the formats added to the list will appear in the Save menu while viewing a report or dashboard. By default, the list in the Export Settings editor is empty, meaning all available export formats with default settings will be displayed in the Save menu when viewing a report or dashboard.
Search in the Property panel
The ability to search within the Property panel has been added. The search function works on the first level of the property list, meaning it does not search for nested properties. You can enable or disable the search panel through the Property panel settings.Data dictionary in editors WEB & JS
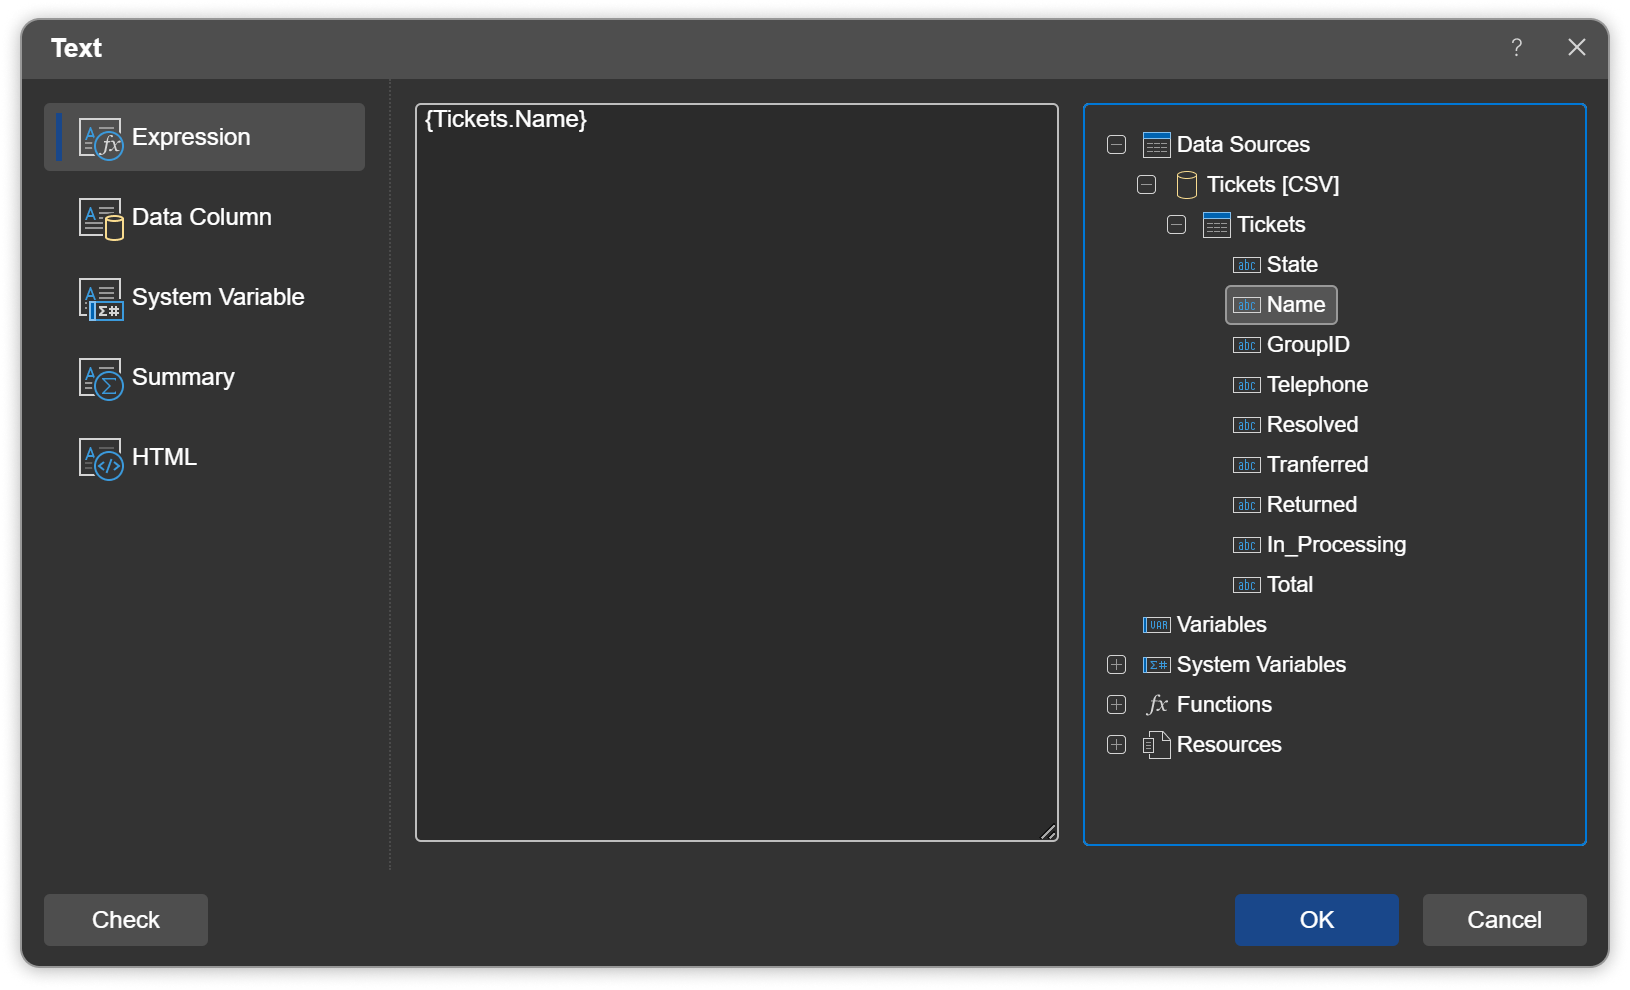
A data dictionary has been added to various component editors in the Web and JS report designer. This enhancement makes it easier to access data dictionary elements when editing report components.

New data source
A new Microsoft Analysis Services data source has been added. To create this data source, select Microsoft Analysis Services from the NoSQL tab in the New Data Source window. After establishing the connection and running a selection query, you can create reports and dashboards based on the data obtained.
Optimization of XML loading speed
The loading and processing speed of XML resources, including data sources, has been optimized and significantly improved. Additionally, the loading time of report templates with XML markup has been reduced.
New events - onClose(), onAssignReport() JS & PHP & Python
Two new events have been added: onClose() and onAssignReport(). The onClose() event (added for JS, PHP, Python report designers) triggers when the Close command is executed in the File menu, while the onAssignReport() event (added for JS report designer) triggers when a report object is assigned to the designer.Rotate chart when viewing dashboard WIN
The WinForms reporting tool now includes the ability to rotate Pie and Doughnut charts when viewing dashboards. Rotation is performed by using the mouse and the left mouse button.