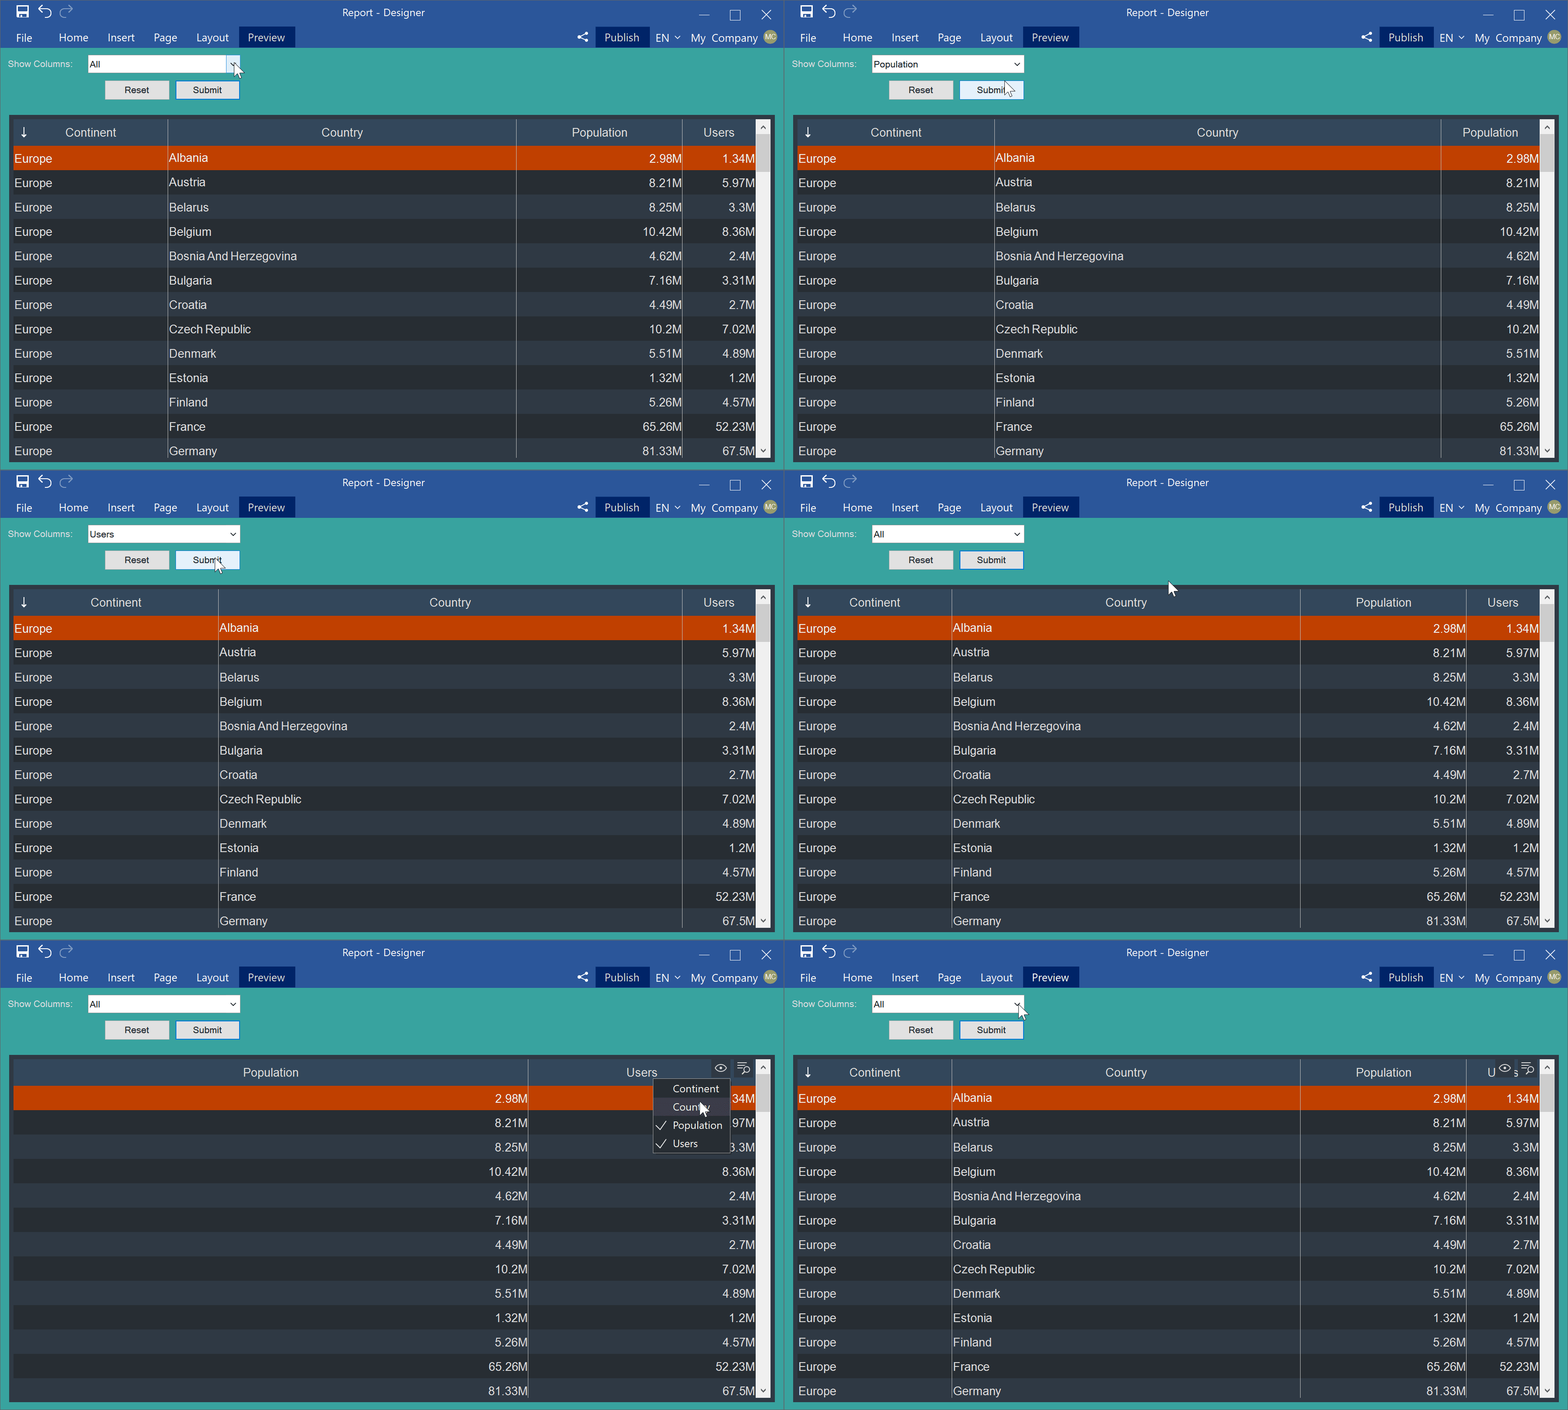
Version 2021.3 of Stimulsoft Reports and Stimulsoft Dashboards contains many innovations and improvements, which we tell you about on the pages of our blog. This article will help you understand how to control the visibility of data fields for the Table element in dashboards.
Column visibility control
In the new version of our products, we have expanded this functionality. Now you can select the list of columns you need when viewing a dashboard in the viewer by simply clicking on the mouse button. This became possible due to the column visibility control, which was added in the new version. All you have to do is uncheck the boxes for the columns you want to hide. The control can be enabled or disabled in the Interaction menu in the dashboard design mode. Work with data becomes more comfortable and, as a result, efficient. At the same time, data tables setting on a dashboard has become even more flexible and customizable.
Control with the help of expression
In addition, you can control the visibility of data columns with the help of the expression, which is specified as the value of the Visible parameter. The result of processing this expression will be a Boolean value. In this case, the visibility of data columns will depend on this expression. If the result is true, a column will be displayed.We hope this article will help you understand how to control the visibility of table columns on a dashboard, and your work with data will be more comfortable and simple. If you have any questions, contact us – we will be glad to help you.


