Greetings to all readers of the Stimulsoft blog! We continue to tell you about the report designer and its components. In the previous article, you learned about the region map, its basic features, its use in dashboards, and the data analysis types it contains. This time, we’re going to tell you about the Image element.
First of all, let’s take a closer look at the features of adding and customizing Image.
You can upload an image from the Internet and report resources using a hyperlink. In addition, you can provide a hyperlink to the data column
So, now let's move on to the use of this element when analyzing data in dashboards.
Social networks have become an integral part of our life. Today it’s almost impossible to meet a person not registered in at least one of the most popular social networks. No wonder, every day, people from all over the world can communicate in real-time, share videos and funny memes, get information on various topics from public pages, read news and even promote their products. We displayed and analyzed the statistics of using social networks worldwide, creating an appropriate dashboard. Using the Image element, we showed logos of such mainstream social networks as Facebook, Twitter, and YouTube.
Every YouTube blogger analyzes the statistics of his channel. In analytics, he can observe the number of likes, dislikes, the common number of subscribers, views, etc. We created a dashboard that displays the statistics of a conditional YouTube channel. Using the Image element, we highlighted such analytics elements as:
You can read about how to create a dashboard with the Image element in the documentation.
Image
In everyday life, an image is a visual way of conveying information, presented as photos, pictures, drawings, and other similar visual tools. In the Stimulsoft report designer, an image is a data visualization element that allows displaying of various graphic objects in a dashboard - photos, logos, images, icons, etc.First of all, let’s take a closer look at the features of adding and customizing Image.
Adding an image
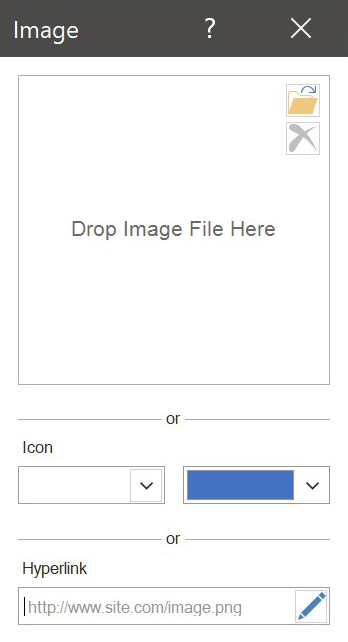
You can add a graphic element to the Image element using the following ways:- upload from a local storage;
- provide a hyperlink to an image;
- select a ready-made icon and a color for it.
You can upload an image from the Internet and report resources using a hyperlink. In addition, you can provide a hyperlink to the data column
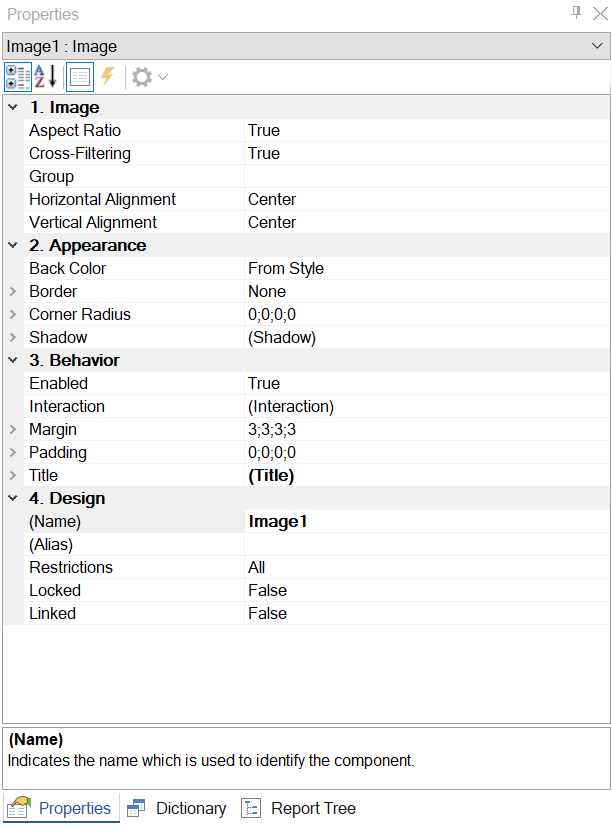
(datacolumn://DataSource.DataColumn) that contains an image in the base64 encoding or variable variable://variablename.Customization of the Image element in the Property panel
In the Properties panel you’ll find options that will let you to customize your graphic object:- stretch, having maintained its proportions;
- align vertically and horizontally;
- select a color;
- customize borders and corner radius;
- change text font, customize shadow, etc.
So, now let's move on to the use of this element when analyzing data in dashboards.
Data analysis in dashboards using the Image element
Solar power is a modern and ecological way of producing electricity. Every year more and more countries master and develop this field by building powerful solar panels. Despite the fact that Germany is not as sunny as Italy or Spain, the Germans are still rapidly developing solar power. We created a dashboard that displayed a solar power factsheet in Germany and, using the Image element, added icons to the following metrics:- the number of solar power systems;
- installed capacity in GW;
- investments made in the development of solar energy;
- percent of total energy generation;
- acceptance of solar farms in the neighborhood;
- feed-in tariffs.
Social networks have become an integral part of our life. Today it’s almost impossible to meet a person not registered in at least one of the most popular social networks. No wonder, every day, people from all over the world can communicate in real-time, share videos and funny memes, get information on various topics from public pages, read news and even promote their products. We displayed and analyzed the statistics of using social networks worldwide, creating an appropriate dashboard. Using the Image element, we showed logos of such mainstream social networks as Facebook, Twitter, and YouTube.
Every YouTube blogger analyzes the statistics of his channel. In analytics, he can observe the number of likes, dislikes, the common number of subscribers, views, etc. We created a dashboard that displays the statistics of a conditional YouTube channel. Using the Image element, we highlighted such analytics elements as:
- likes;
- dislikes;
- subscribers;
- comments;
- shares.
You can read about how to create a dashboard with the Image element in the documentation.
In the next article, we'll take a closer look at the Filter element. If you have any questions regarding the Image element or creating a dashboard with it, contact us. We will be glad to help you.