When creating dashboards, you often need to filter data. We have covered some methods in previous articles, made videos on others, and some information is only available in the documentation. This article serves as a guide to all the methods for filtering data in dashboards, starting with filtering in queries.
All of the above functionality does not cover interactive data filtering. Interactive filtering refers to users selecting values directly in the dashboard view mode. More details on this feature are discussed below.
In the case where the user selects a value, each variable functions as a parameter and is displayed in the parameters panel in the viewer. When viewing a dashboard (and similarly in reports), the user selects or enters a value and then clicks the Submit button for the value to be applied.
An attentive reader might wonder: where will the selected value be applied?
And we have good news: the selected value can be applied in multiple areas. It can be used in queries, data transformation filters, element data transformations, element filters, and even in element expressions - such as ternary operands or functions with conditions. In other words, you can use report variables wherever they are applicable. For more details, you can read further here and here.
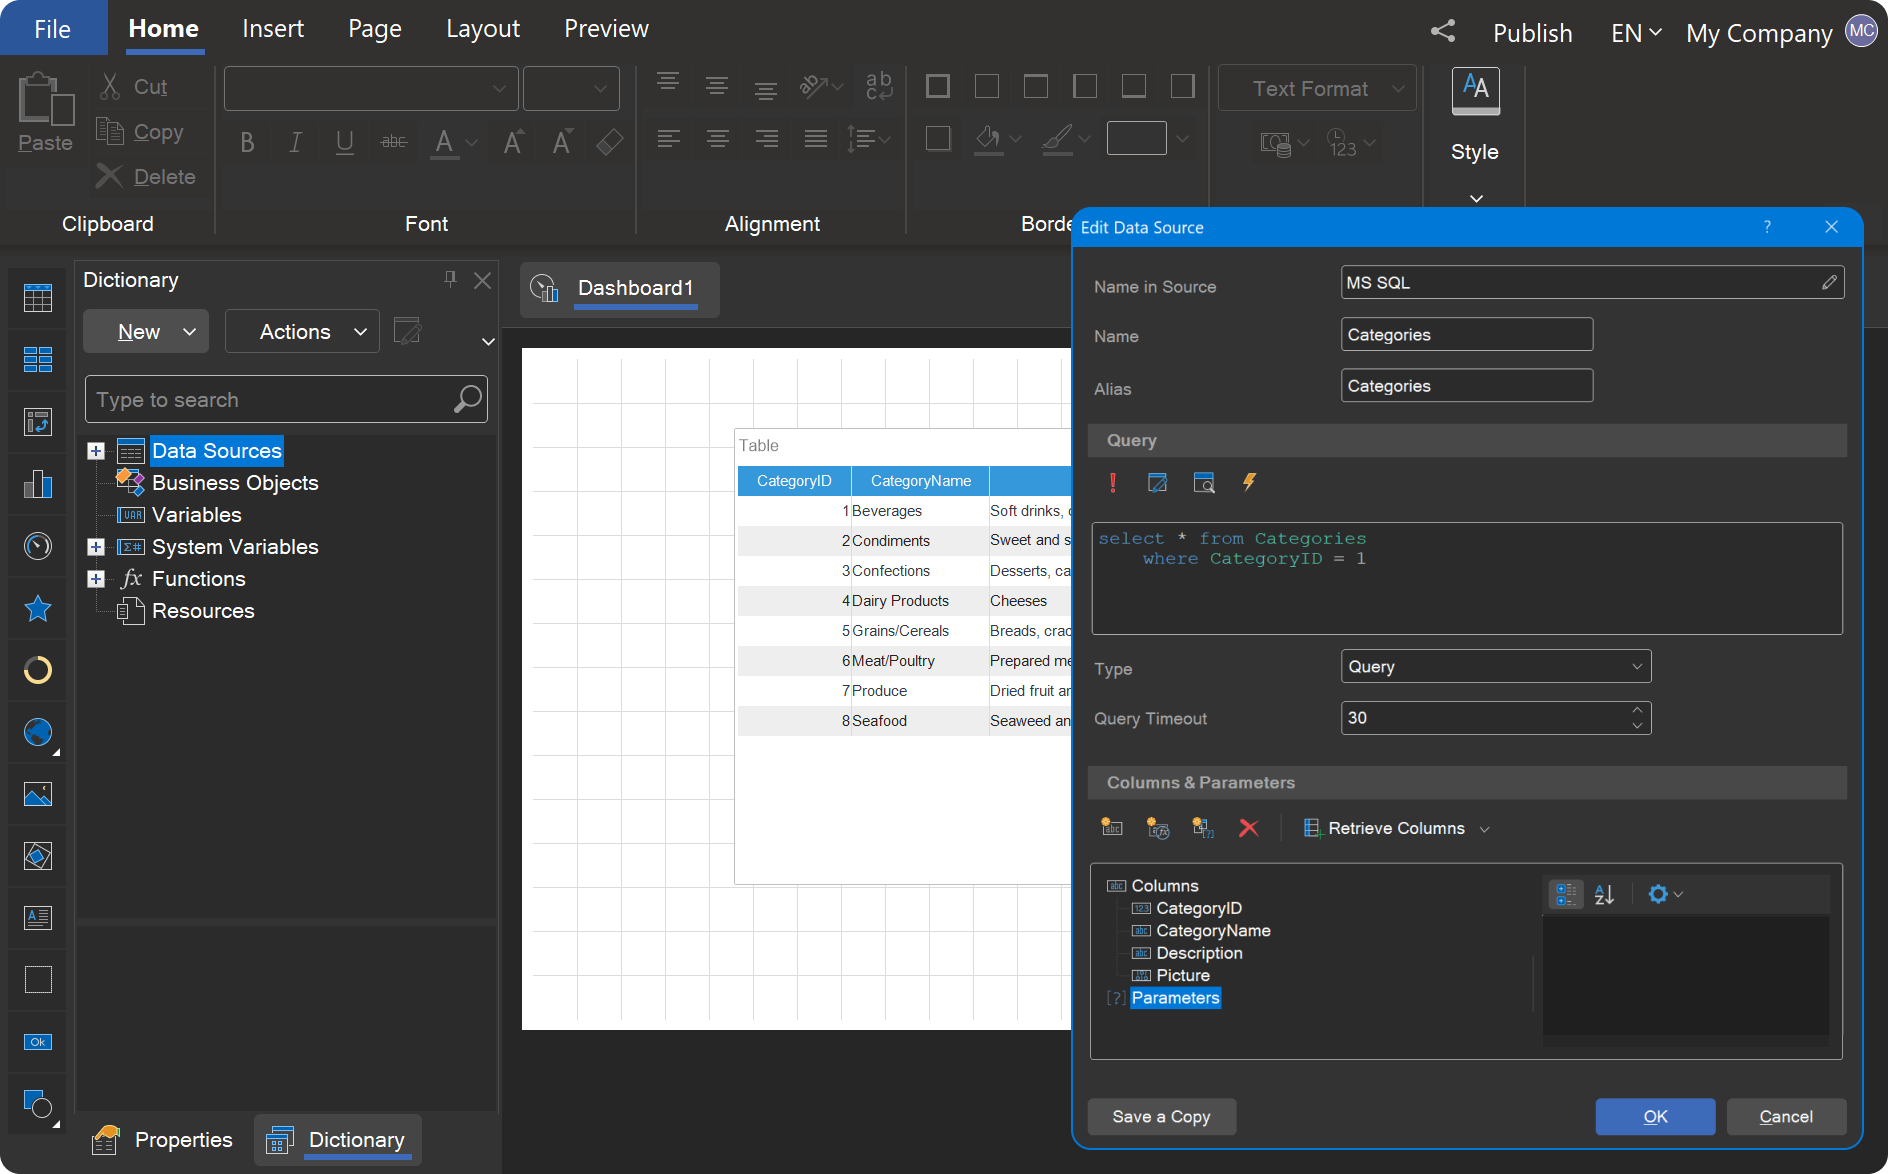
SQL filtering
One of the primary methods for filtering data is by executing a query with parameters. We have discussed this in detail in our articles on Parameters in a query and Using a Stored Procedure in the design of reports. This method is highly reliable because the filtering occurs during the data retrieval process, meaning the reporting engine receives only the filtered data. The main limitation of this approach is that it requires a data source that supports queries and parameters, and the restrictions are controlled solely by the SQL language.
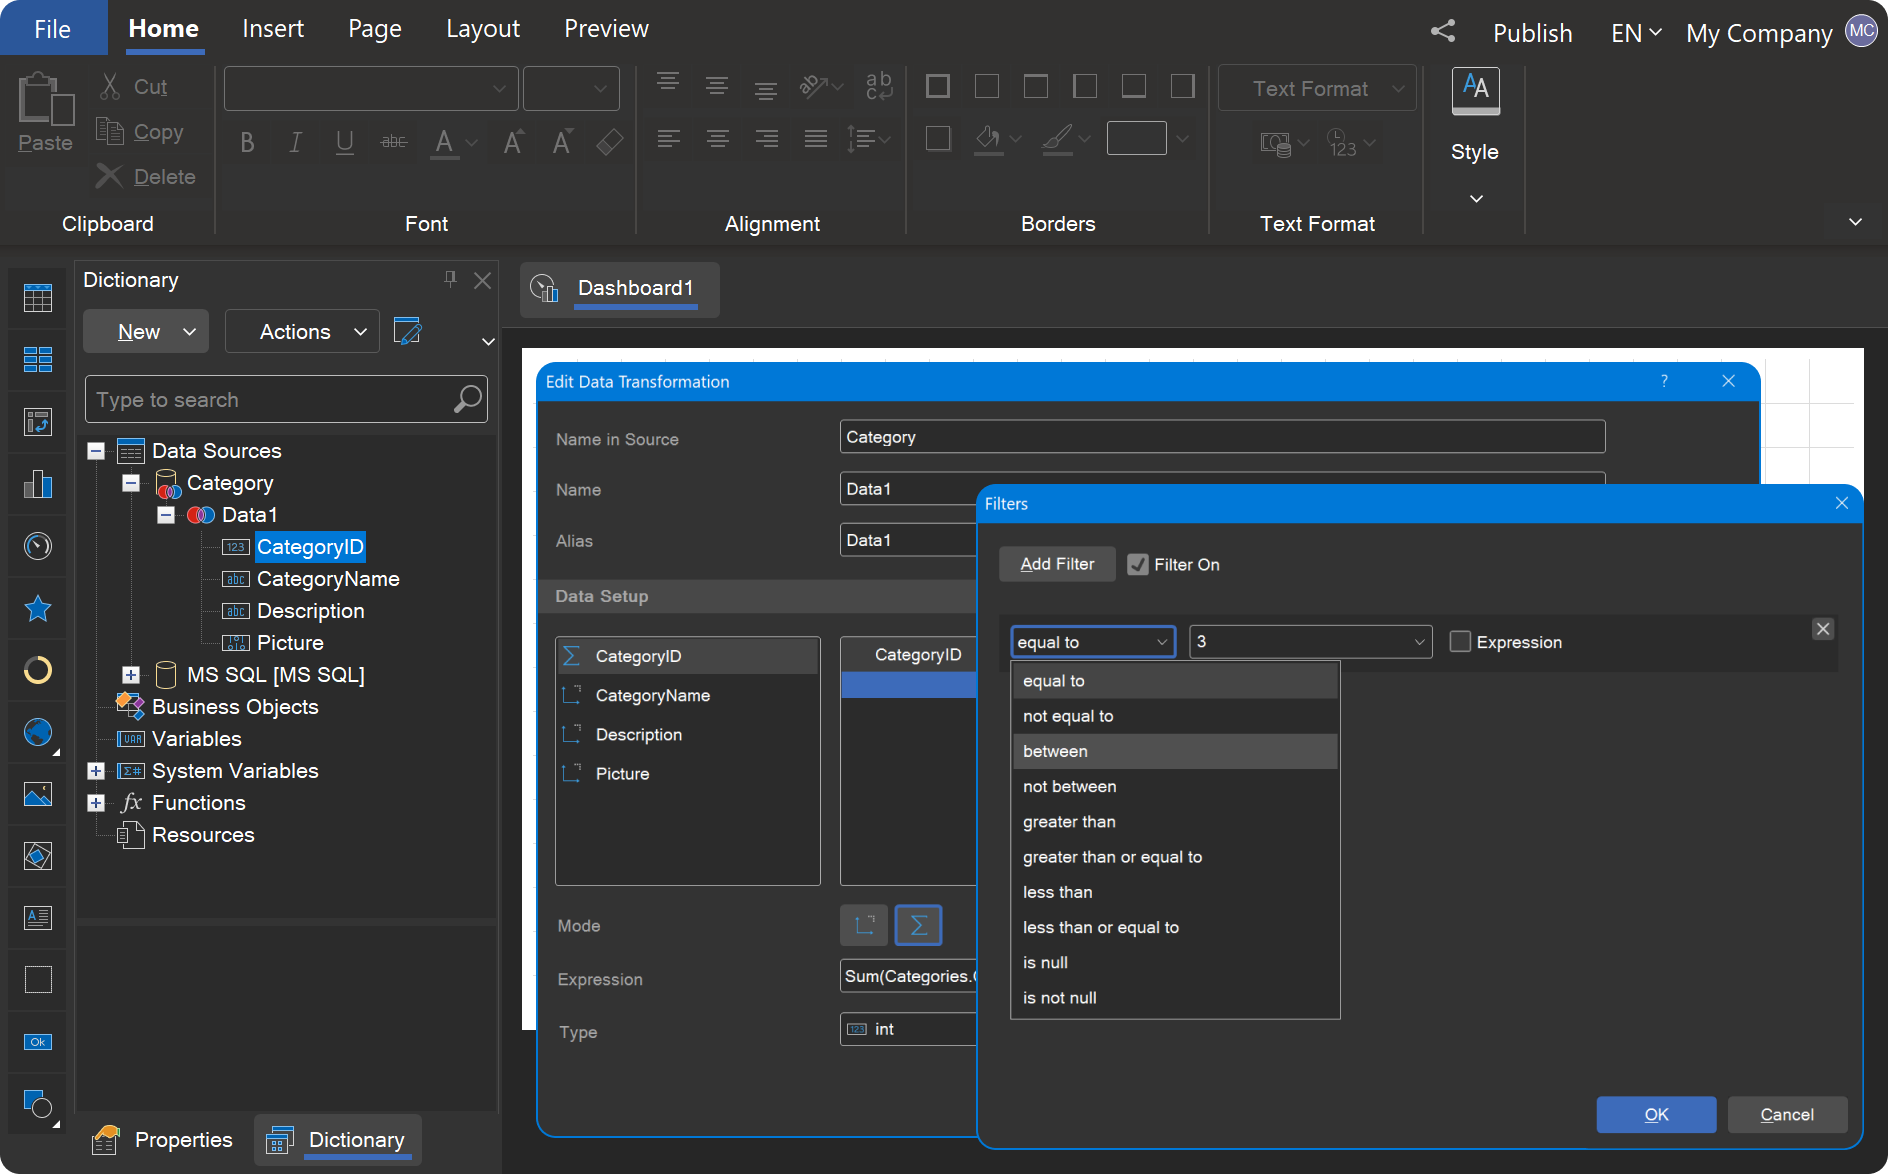
Data transformation
After retrieving data, you can process it in the dictionary, and then use it for creating reports or dashboards. The Data Transformation tool is specifically designed for this purpose. For more details on Data Transformation, refer to the relevant section of the user manual. This tool allows you to combine data tables, sort, filter, group data, and more.
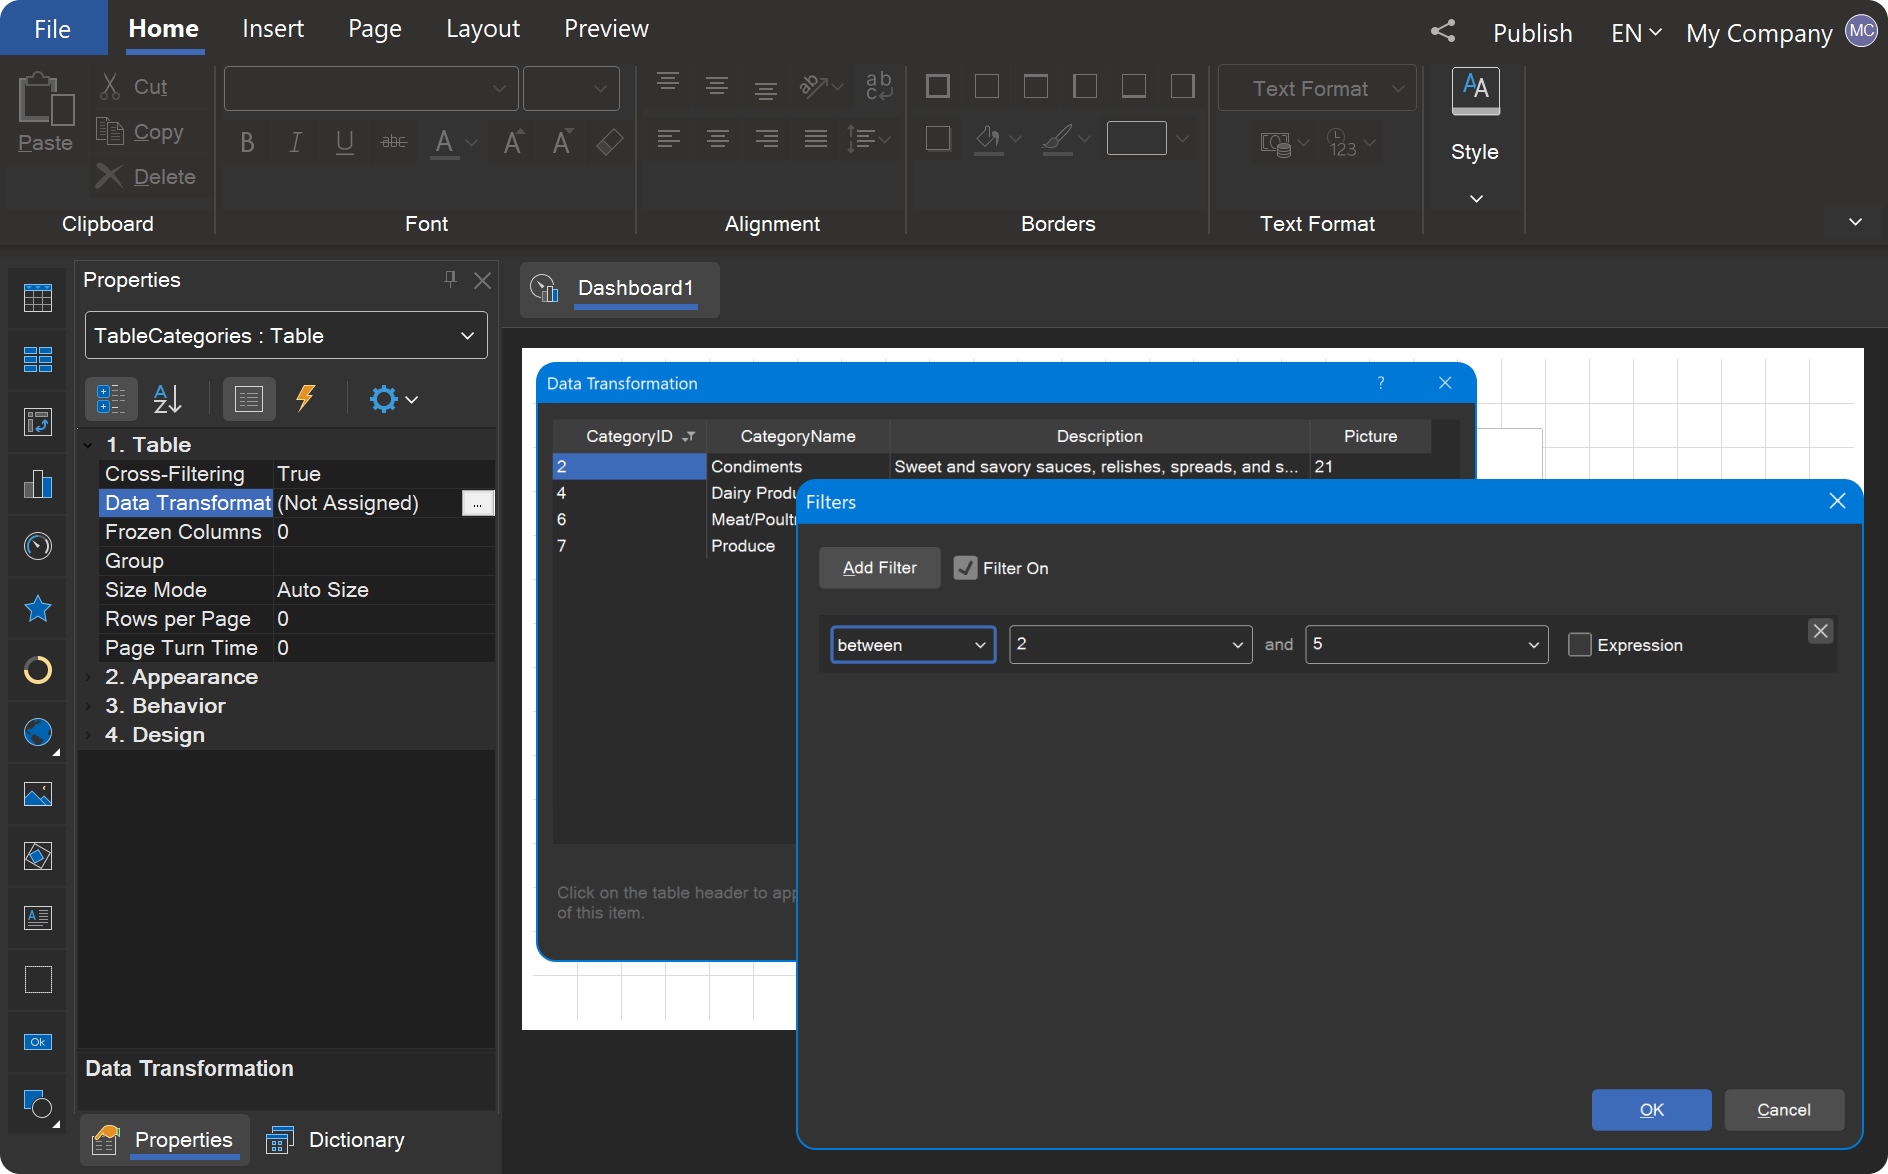
Data transformation of dashboard elements
Each dashboard element that works with data sources has its own data transformation tool. To access the editor for processing data specific to an element, click the Browse button in the Data Transformation property of that element. For more information on this functionality, refer to the corresponding section of the user manual. Note that processing in this context applies only to the data of the current element.
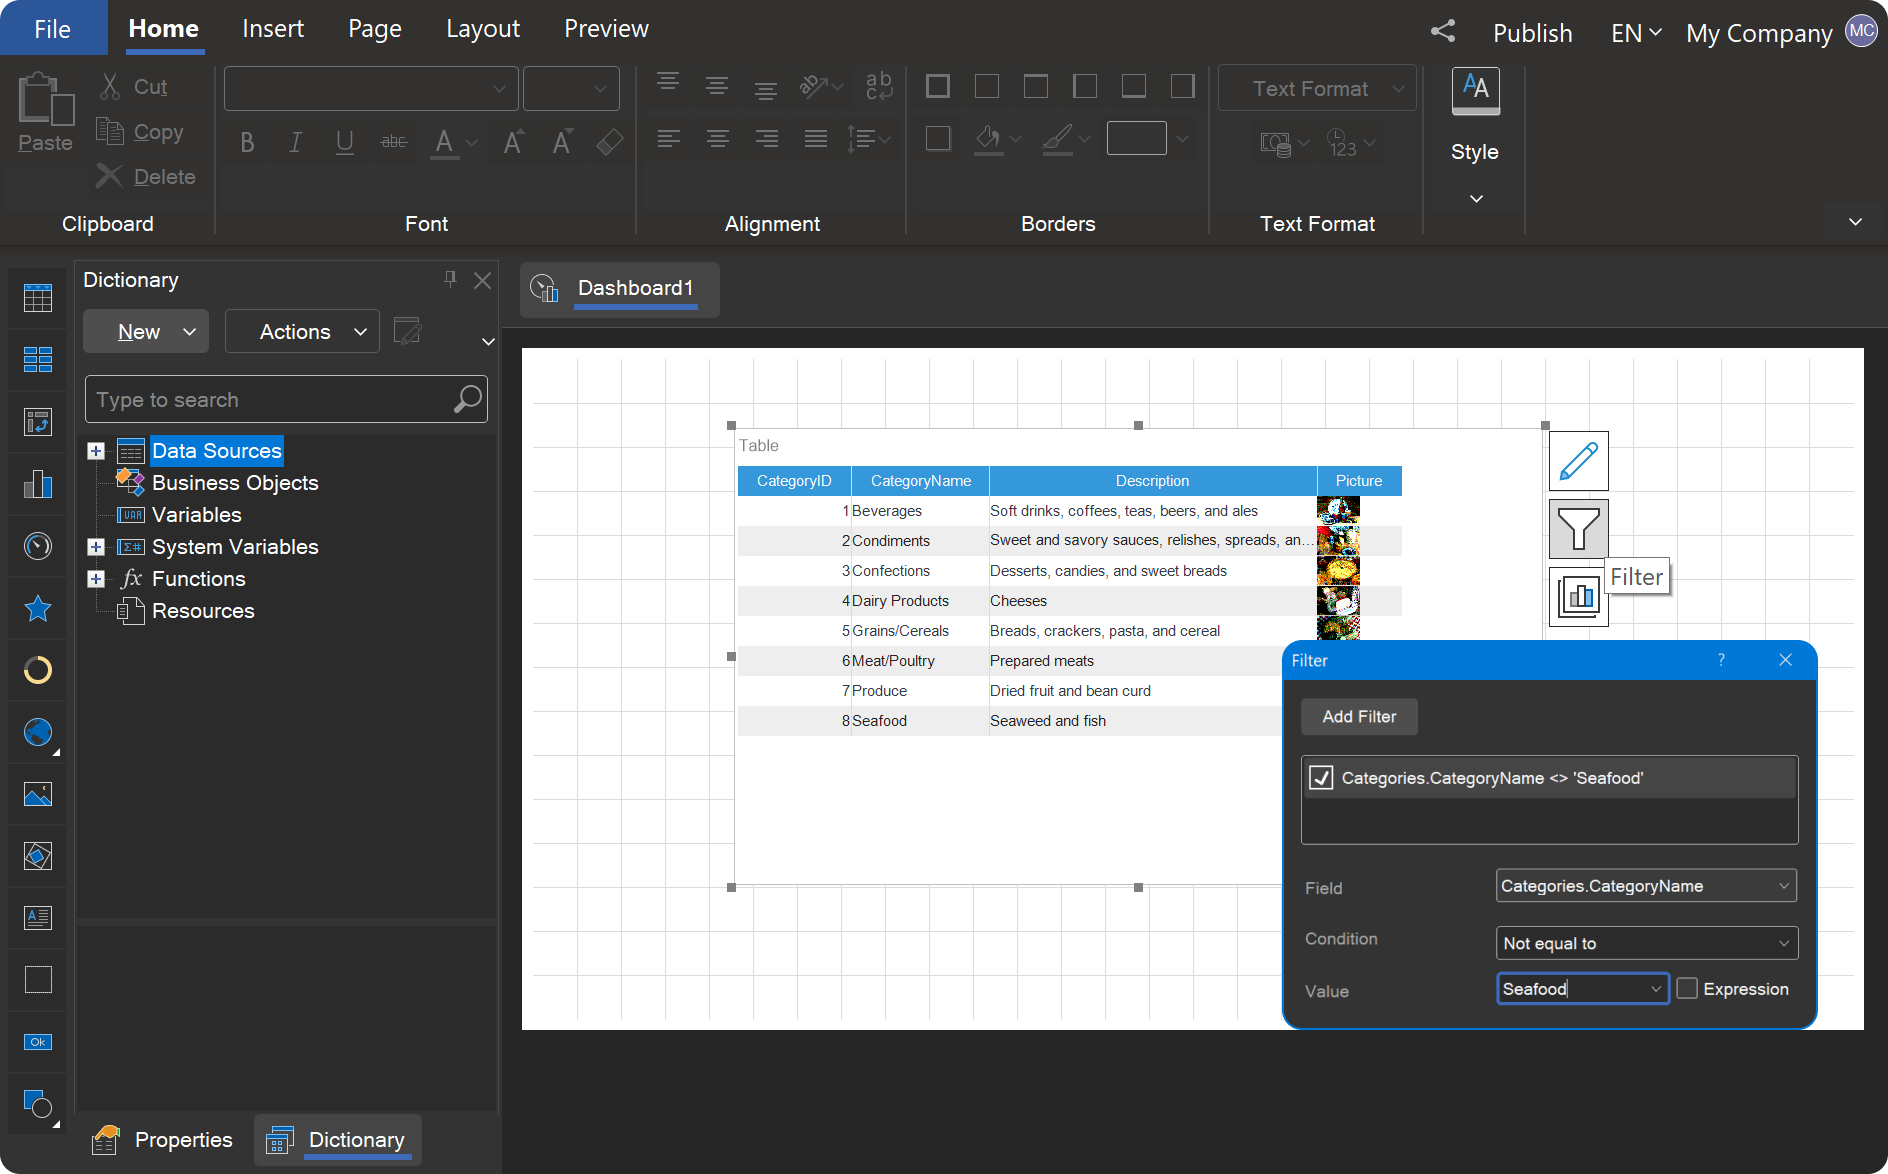
Filters of dashboard elements
Each dashboard element that works with data sources can be configured with its own data filter. For more details, refer to the relevant section of the documentation.
Top N
There is a specific type of filter that lets you display a set number of top values. For more information, check the relevant section of the documentation.Filters of the Table element
The Table element allows you to set up custom filters that will be applied to both the Table element itself and any related elements when viewing the dashboard. You can configure these filters through the header menu in the Table element. Note!All of the above functionality does not cover interactive data filtering. Interactive filtering refers to users selecting values directly in the dashboard view mode. More details on this feature are discussed below.
Filtering elements
There are various filtering elements that can be added to a dashboard, including List Box, Combo Box, Date Picker, Number Box, Tree View, and Tree View Box. Each serves a specific purpose. You should know that these filters can impact interconnected elements on the dashboard. For more information about how dashboard elements interact with each other, refer to the corresponding section of our instruction manual.Filters from elements when viewing
Certain elements, such as Table, Region Map, and Chart, support interactive filtering, enabling users to filter related data by selecting a value within the element itself. In tables, this is done through column headers; in regional maps, by selecting a geographic object; and in charts, by selecting a graphic element. For more information on this feature, see the chapter Relationship of Elements. You can disable interactive filtering for Table, Region Map, and Chart elements using the Interaction menu for each element.Report variables
Historically, variables existed in Stimulsoft products before dashboards were introduced. These variables are specific to the current report, which is why they are often referred to as report variables, though in the dictionary they are simply called Variables. When using variables to filter data, there are essentially two approaches: using a variable without user input or allowing the user to select a value.In the case where the user selects a value, each variable functions as a parameter and is displayed in the parameters panel in the viewer. When viewing a dashboard (and similarly in reports), the user selects or enters a value and then clicks the Submit button for the value to be applied.
An attentive reader might wonder: where will the selected value be applied?
And we have good news: the selected value can be applied in multiple areas. It can be used in queries, data transformation filters, element data transformations, element filters, and even in element expressions - such as ternary operands or functions with conditions. In other words, you can use report variables wherever they are applicable. For more details, you can read further here and here.