We are pleased to announce the new version of Stimulsoft Reports 2015.2. The new product, updated components, tools and libraries for data analysis and processing allow .NET Framework, JavaScript, PHP, Flex, and Java developers to create very powerful reporting system for their applications – desktop or web and for mobile devices. All the significant changes are described below.
New Product Stimulsoft Reports.JS
A simple and flexible solution for working with reports. All you need is a web browser with support for JavaScript and HTML5. Installation of additional .NET, Java or Flash components is not required. Therefore, Stimulsoft Reports.JS will work on most devices (from desktop to mobile devices). Stimulsoft Reports.JS can work on a client side (does not require the server side) and on a server side. The product is perfectly compatible with Node.js. In this case, the functionality of Stimulsoft Reports.JS is not less than other products of Stimulsoft.

Stimulsoft Reports.Ultimate – Ultra All Inclusive
Previously Stimulsoft Reports.Ultimate did not include Stimulsoft Reports.Flex, Stimulsoft Reports.PHP and Stimulsoft Reports.Java. In the release 2015.2 Stimulsoft Reports.Ultimate will include all these products. Besides, the band new Stimulsoft Reports.JS will also be available in Stimulsoft Reports.Ultimate. By purchasing Stimulsoft Reports.Ultimate, you get the best cross-platform tools to develop reports.

Report Design and Integration Service
We are launching the new service that will have three options:
1. Report conversion. Reports created in third-party reporting tools are converted into the format of Stimulsoft Reports.
2. Report design from scratch by the predefined terms of reference.
3. Integration of Stimulsoft Reports into your applications.




As a result, the user will get the reports that meet the requirements and are compatible with any Stimulsoft Reports products or an integrated project.
Users of the service will save their time, because a team of our specialists will take your troubles and solve them.
Support for MongoDB
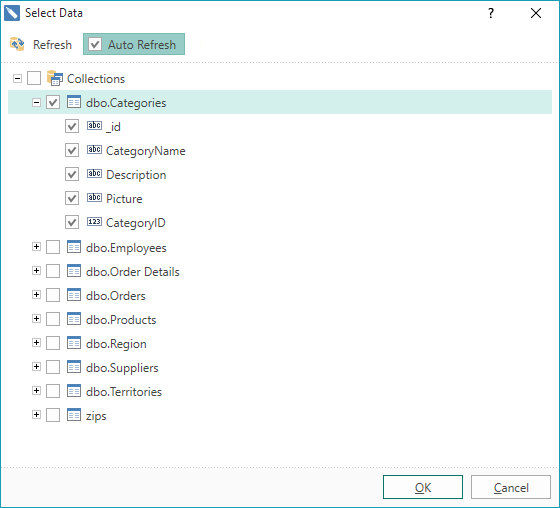
With this release, our products support NoSQL database. Now you can use the MongoDB data source when creating reports.
OData Adapter
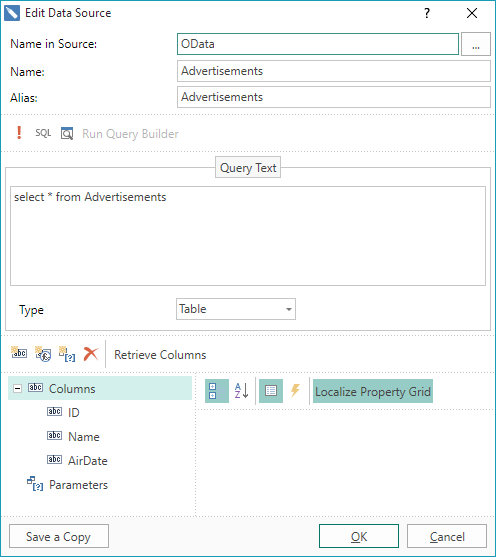
We added the OData adapter into our reporting tools. With this adapter you can retrieve data by the OData protocol, including using the REST requests and parameters.
Built-in Data Adapters
Previously, when creating reports and transmitting data, built-in and external data adapters were used. In order to use external data adapters, it was necessary to download the adapter from the site, unzip the file, add a reference to the dll and etc. And only after that you could work with a particular type of data. From the version 2015.2 all adapters that were external, were grouped and embedded into the report engine.
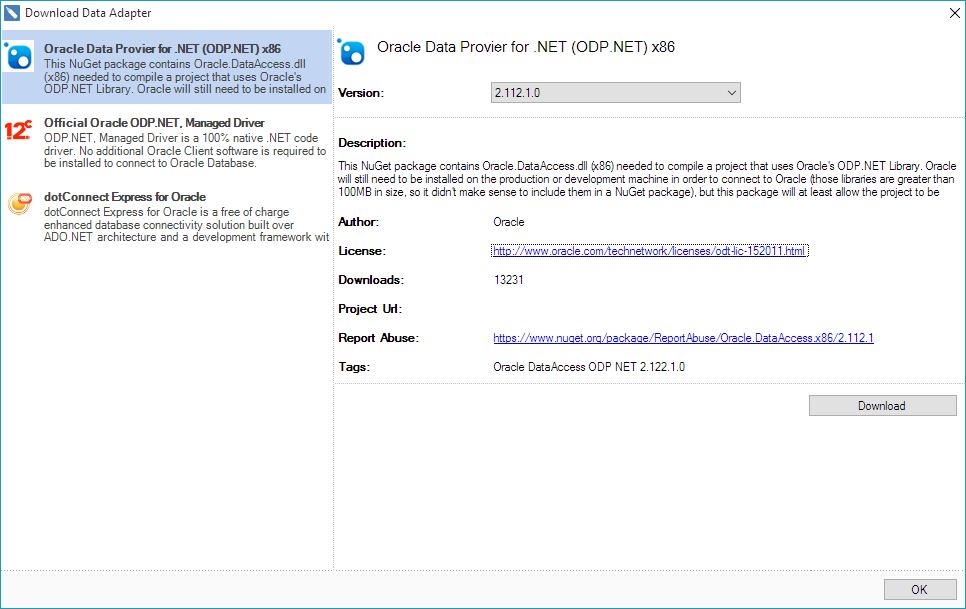
We cannot distribute the database libraries from vendors. So the user, when selecting a desired data source, will be prompted to download the necessary libraries from the NuGet gallery.
Gauge Component
The information in the reports looks better if it visualized. One of the tools for data visualization is the Gauge component. This one is designed to display a specific value out of the range of values. Gauges are divided into linear and radial. From the release of 2015.2 in the reporting tools Stimulsoft Reports.Net and Stimulsoft Reports.Wpf will have the Gauge component.
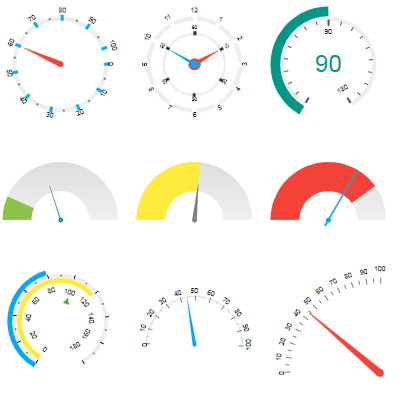
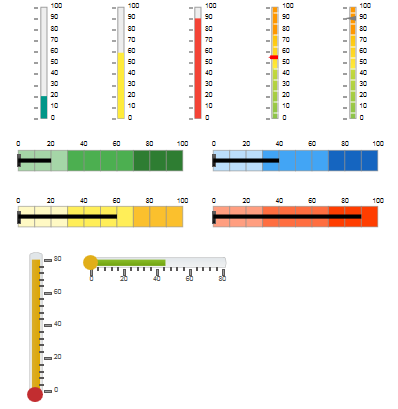
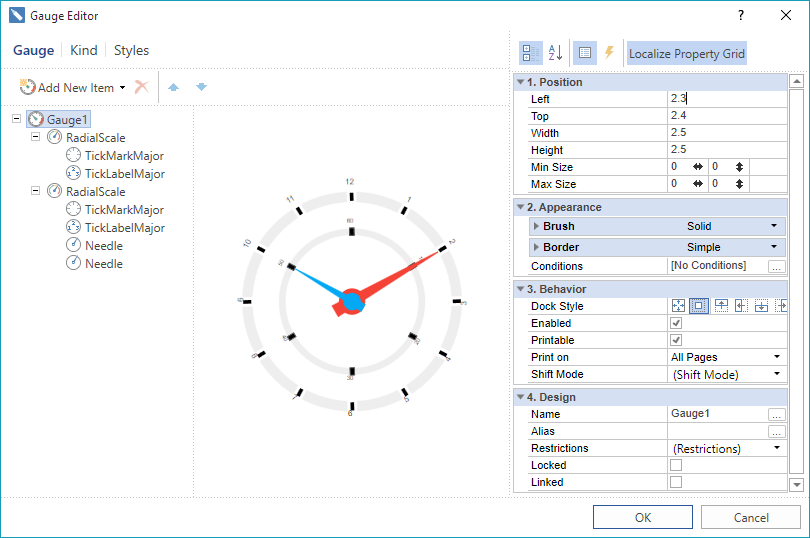
Gauges are presented as a separate component in the report designer. This component has a fully functional editor, with help of what the gauges can be configured.
New Form to Create New Data Source
In earlier versions, it was necessary to call the new connection command to create a new data source. Then the New Data Source command was called, and, based on this connection, the data source was created. After in-depth analysis, taking into account the wishes of our users, we optimized this process and redesigned the form of creating the new data source. Now you need to select New Data Source in the data dictionary, define the source type, select the connection string, and select data tables.
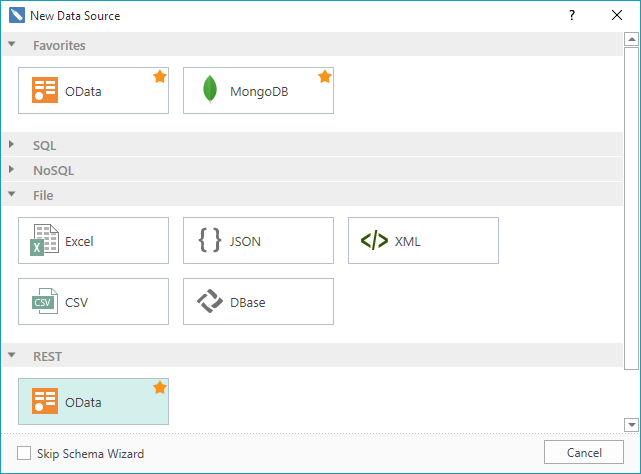
All types of data sources are grouped by the type of a connection. It is also possible to create a list of favorite data sources.
Excel Data Source
Starting with the version 2015.2, you can retrieve data from the Excel file. To do this, you should select the New Data Source and identify the type of source as Excel or just drag the excel file to the data dictionary. Enable the First line parameter as the title, if necessary. Each sheet of the Excel file is imported into a separate data table. Now, based on these data, you can create reports.
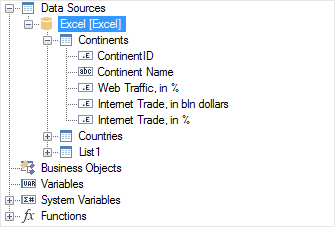
The same way data can be obtained from a CSV and Dbase files.
Mirror Margins
Now you can create reports as books. We have added support for mirror margins. To activate the mirror margins you should set the Mirror Margins property to true.
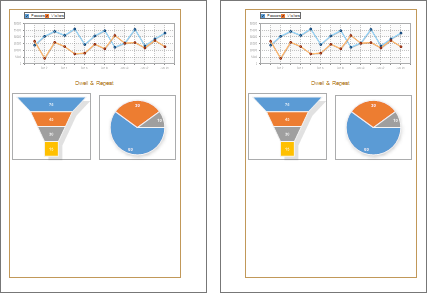
Animation of Charts
In the version2015.2 in Stimulsoft Reports.Wpf and Stimulsoft Reports.Web the chart component became animated. This significantly increases the attractiveness of reports and improves their visual perception.
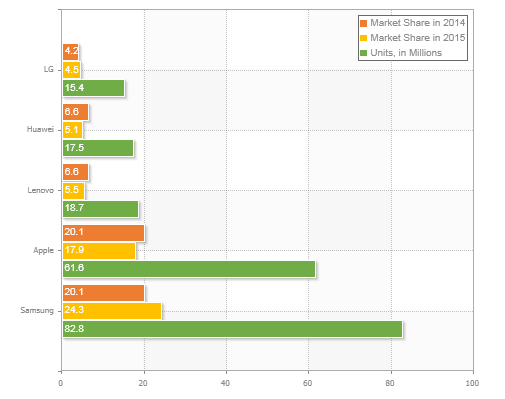
New Settings for Chart Styles
We added new functionality to the chart style to adjust – areas, series labels, legends, axes, grid lines etc.
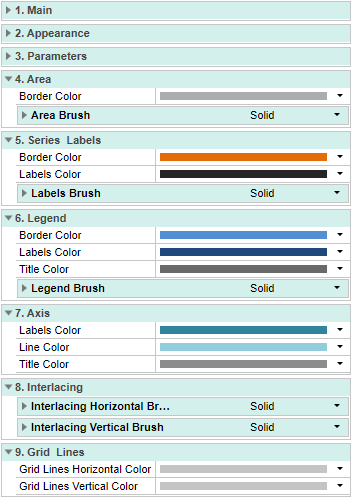
Aligning Axes Labels by Center
According to numerous requests from users, we have added the ability to align the axes labels by center when word wrap.
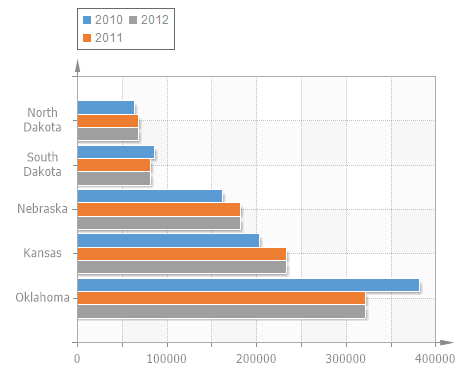
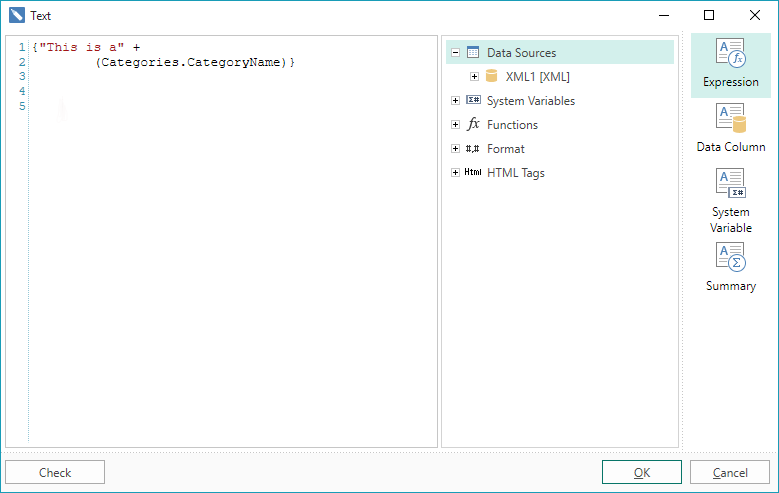
New Text Editor in WPF
The text editor can contain text, expressions, references to the elements of the data dictionary, conditions etc. We have improved the editor to simplify the work when typing text. The main advantages that has the new editor are:
1 Line numbering;
2 Syntax highlighting;
3 The button the check expressions.
New Interaction Editor
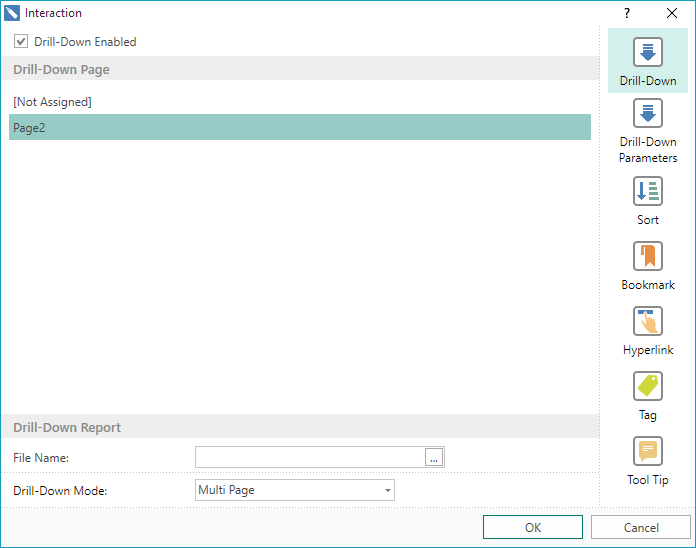
Previously, the components had a group of properties which were used to setup interactions in reports. Now we have added a special editor, which contains commands and interaction parameters in the report. Using this editor now it is much easier and faster to create interactive reports.
Saving Reports in JSON
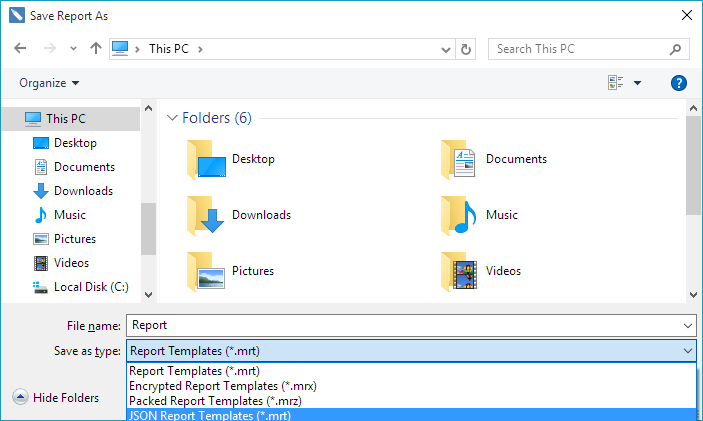
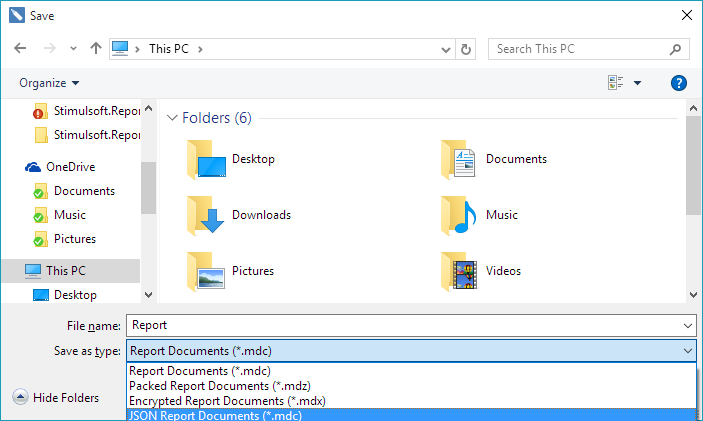
From the version 2015.1, we began to support the JSON data source. In the release 2015.2 we went ahead and added the ability to save the report into JSON. And you can save both a report template and a rendered report. To do this, change the type of the result and select JSON Report Template (Document) in the Save dialog.
Search Panel in Mobile Viewer
The fully functional search bar is added into the HTML5 viewer. In order to call the panel, press the search button on the toolbar of the viewer. The search can be made case-sensitive, as well as the integrity of words.

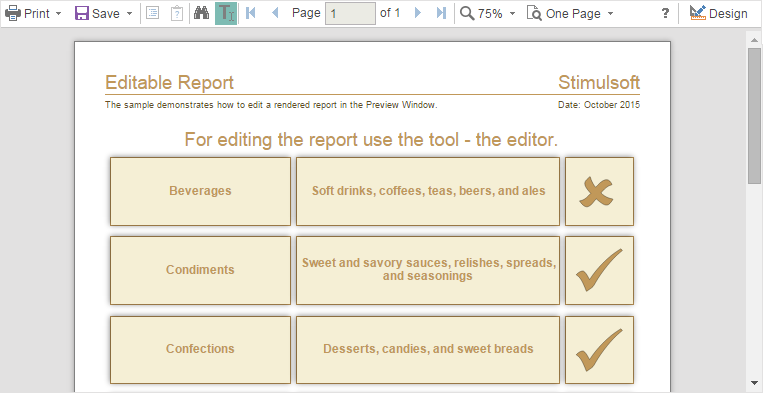
Editable Reports in Mobile Viewer
Now you can edit reports in the HTML5 viewer. To do this set the Editable property for the fields in the report template. Then, load this report in the viewer. Select the Editor tool to modify the fields in the viewer window.
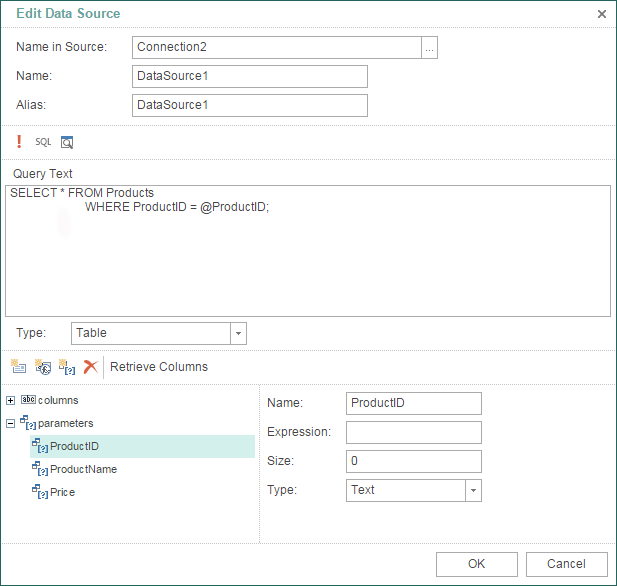
SQL Parameters in Mobile Designer
In the release of 2015.2 in Mobile Designer, when creating the SQL queries it is possible to use parameters.
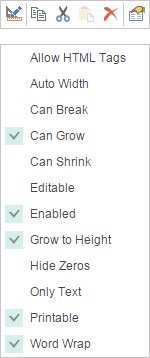
Context Menu in Mobile Designer
New commands and some new properties are placed in the context menu.
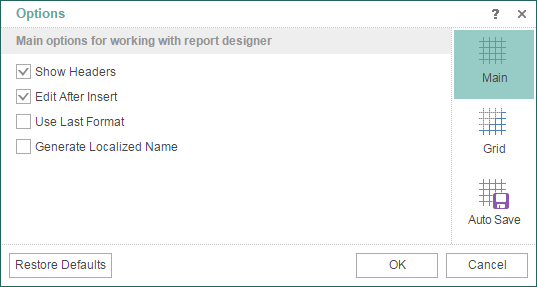
Options Window in Mobile Designer
In Mobile designer we added the Options window in which additional designer settings are located. In order to call this window you should select the Options command in the File menu. Now you can enable or disable the header of components, grid and define the auto save mode.
Multiselection of Components in MVC Designer
When editing a report template, the same settings can be applied to components of the same type. In order to speed up the editing you can now select an unlimited number of components and to apply the desired settings for them.

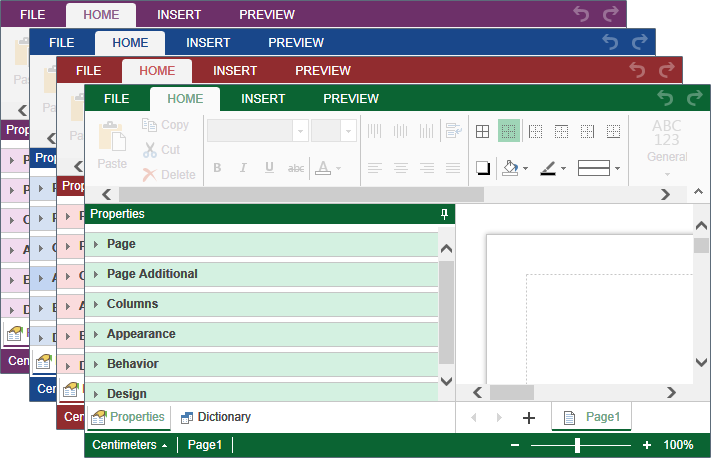
New Themes in MVC Designer
It added a huge number of color schemes and interface theme MS Office 2013. The picture below presents a number of new color schemes.
New Exports in PHP, Java, Flex
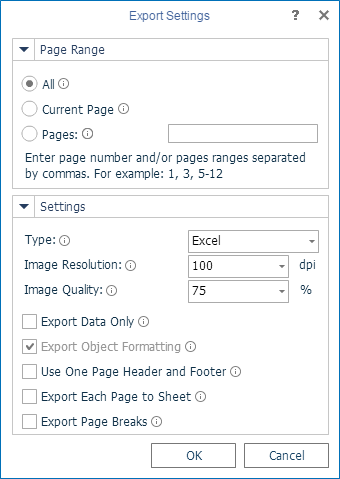
Earlier, export to Excel was only for versions 97-2003. Following suggestions of our clients have added export to Excel 2007/2013.
Dependent Variables in MvcViewer
The MVC viewer now has support for the dependent variables. You can create a hierarchy of variables, and filter data in the Master-Detail.
By the links below you can see the full list of changes and download the latest versions of the products
Stimulsoft Reports.Ultimate
Stimulsoft Reports.Web
Stimulsoft Reports.Net
Stimulsoft Reports.Wpf
Stimulsoft Reports.Silverlight
Stimulsoft Reports.WinRT
Stimulsoft Reports.JS
Stimulsoft Reports.Flex
Stimulsoft Reports.PHP
Stimulsoft Reports.Java
Stimulsoft Reports.Server
New Product Stimulsoft Reports.JS
A simple and flexible solution for working with reports. All you need is a web browser with support for JavaScript and HTML5. Installation of additional .NET, Java or Flash components is not required. Therefore, Stimulsoft Reports.JS will work on most devices (from desktop to mobile devices). Stimulsoft Reports.JS can work on a client side (does not require the server side) and on a server side. The product is perfectly compatible with Node.js. In this case, the functionality of Stimulsoft Reports.JS is not less than other products of Stimulsoft.

Stimulsoft Reports.Ultimate – Ultra All Inclusive
Previously Stimulsoft Reports.Ultimate did not include Stimulsoft Reports.Flex, Stimulsoft Reports.PHP and Stimulsoft Reports.Java. In the release 2015.2 Stimulsoft Reports.Ultimate will include all these products. Besides, the band new Stimulsoft Reports.JS will also be available in Stimulsoft Reports.Ultimate. By purchasing Stimulsoft Reports.Ultimate, you get the best cross-platform tools to develop reports.

Report Design and Integration Service
We are launching the new service that will have three options:
1. Report conversion. Reports created in third-party reporting tools are converted into the format of Stimulsoft Reports.
2. Report design from scratch by the predefined terms of reference.
3. Integration of Stimulsoft Reports into your applications.


As a result, the user will get the reports that meet the requirements and are compatible with any Stimulsoft Reports products or an integrated project.
Users of the service will save their time, because a team of our specialists will take your troubles and solve them.
Support for MongoDB
With this release, our products support NoSQL database. Now you can use the MongoDB data source when creating reports.

OData Adapter
We added the OData adapter into our reporting tools. With this adapter you can retrieve data by the OData protocol, including using the REST requests and parameters.

Built-in Data Adapters
Previously, when creating reports and transmitting data, built-in and external data adapters were used. In order to use external data adapters, it was necessary to download the adapter from the site, unzip the file, add a reference to the dll and etc. And only after that you could work with a particular type of data. From the version 2015.2 all adapters that were external, were grouped and embedded into the report engine.

We cannot distribute the database libraries from vendors. So the user, when selecting a desired data source, will be prompted to download the necessary libraries from the NuGet gallery.
Gauge Component
The information in the reports looks better if it visualized. One of the tools for data visualization is the Gauge component. This one is designed to display a specific value out of the range of values. Gauges are divided into linear and radial. From the release of 2015.2 in the reporting tools Stimulsoft Reports.Net and Stimulsoft Reports.Wpf will have the Gauge component.


Gauges are presented as a separate component in the report designer. This component has a fully functional editor, with help of what the gauges can be configured.

New Form to Create New Data Source
In earlier versions, it was necessary to call the new connection command to create a new data source. Then the New Data Source command was called, and, based on this connection, the data source was created. After in-depth analysis, taking into account the wishes of our users, we optimized this process and redesigned the form of creating the new data source. Now you need to select New Data Source in the data dictionary, define the source type, select the connection string, and select data tables.

All types of data sources are grouped by the type of a connection. It is also possible to create a list of favorite data sources.
Excel Data Source
Starting with the version 2015.2, you can retrieve data from the Excel file. To do this, you should select the New Data Source and identify the type of source as Excel or just drag the excel file to the data dictionary. Enable the First line parameter as the title, if necessary. Each sheet of the Excel file is imported into a separate data table. Now, based on these data, you can create reports.

The same way data can be obtained from a CSV and Dbase files.
Mirror Margins
Now you can create reports as books. We have added support for mirror margins. To activate the mirror margins you should set the Mirror Margins property to true.

Animation of Charts
In the version2015.2 in Stimulsoft Reports.Wpf and Stimulsoft Reports.Web the chart component became animated. This significantly increases the attractiveness of reports and improves their visual perception.

New Settings for Chart Styles
We added new functionality to the chart style to adjust – areas, series labels, legends, axes, grid lines etc.

Aligning Axes Labels by Center
According to numerous requests from users, we have added the ability to align the axes labels by center when word wrap.

New Text Editor in WPF
The text editor can contain text, expressions, references to the elements of the data dictionary, conditions etc. We have improved the editor to simplify the work when typing text. The main advantages that has the new editor are:
1 Line numbering;
2 Syntax highlighting;
3 The button the check expressions.

New Interaction Editor
Previously, the components had a group of properties which were used to setup interactions in reports. Now we have added a special editor, which contains commands and interaction parameters in the report. Using this editor now it is much easier and faster to create interactive reports.

Saving Reports in JSON
From the version 2015.1, we began to support the JSON data source. In the release 2015.2 we went ahead and added the ability to save the report into JSON. And you can save both a report template and a rendered report. To do this, change the type of the result and select JSON Report Template (Document) in the Save dialog.


Search Panel in Mobile Viewer
The fully functional search bar is added into the HTML5 viewer. In order to call the panel, press the search button on the toolbar of the viewer. The search can be made case-sensitive, as well as the integrity of words.
Editable Reports in Mobile Viewer
Now you can edit reports in the HTML5 viewer. To do this set the Editable property for the fields in the report template. Then, load this report in the viewer. Select the Editor tool to modify the fields in the viewer window.

SQL Parameters in Mobile Designer
In the release of 2015.2 in Mobile Designer, when creating the SQL queries it is possible to use parameters.

Context Menu in Mobile Designer
New commands and some new properties are placed in the context menu.

Options Window in Mobile Designer
In Mobile designer we added the Options window in which additional designer settings are located. In order to call this window you should select the Options command in the File menu. Now you can enable or disable the header of components, grid and define the auto save mode.

Multiselection of Components in MVC Designer
When editing a report template, the same settings can be applied to components of the same type. In order to speed up the editing you can now select an unlimited number of components and to apply the desired settings for them.

New Themes in MVC Designer
It added a huge number of color schemes and interface theme MS Office 2013. The picture below presents a number of new color schemes.

New Exports in PHP, Java, Flex
Earlier, export to Excel was only for versions 97-2003. Following suggestions of our clients have added export to Excel 2007/2013.

Dependent Variables in MvcViewer
The MVC viewer now has support for the dependent variables. You can create a hierarchy of variables, and filter data in the Master-Detail.
By the links below you can see the full list of changes and download the latest versions of the products
Stimulsoft Reports.Ultimate
Stimulsoft Reports.Web
Stimulsoft Reports.Net
Stimulsoft Reports.Wpf
Stimulsoft Reports.Silverlight
Stimulsoft Reports.WinRT
Stimulsoft Reports.JS
Stimulsoft Reports.Flex
Stimulsoft Reports.PHP
Stimulsoft Reports.Java
Stimulsoft Reports.Server