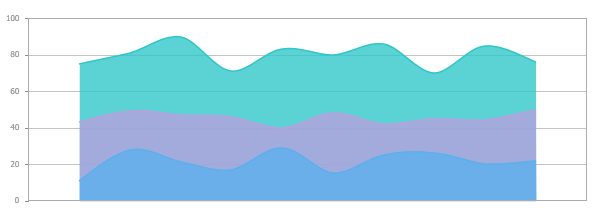
Стиль оформления отчета влияет на восприятие представленной информации в нем. Особенно это важно, если речь идет о графических компонентах. В релизе 2015.3 мы добавили новые стили оформления для таких компонентов визуализации данных как диаграммы и индикаторы.