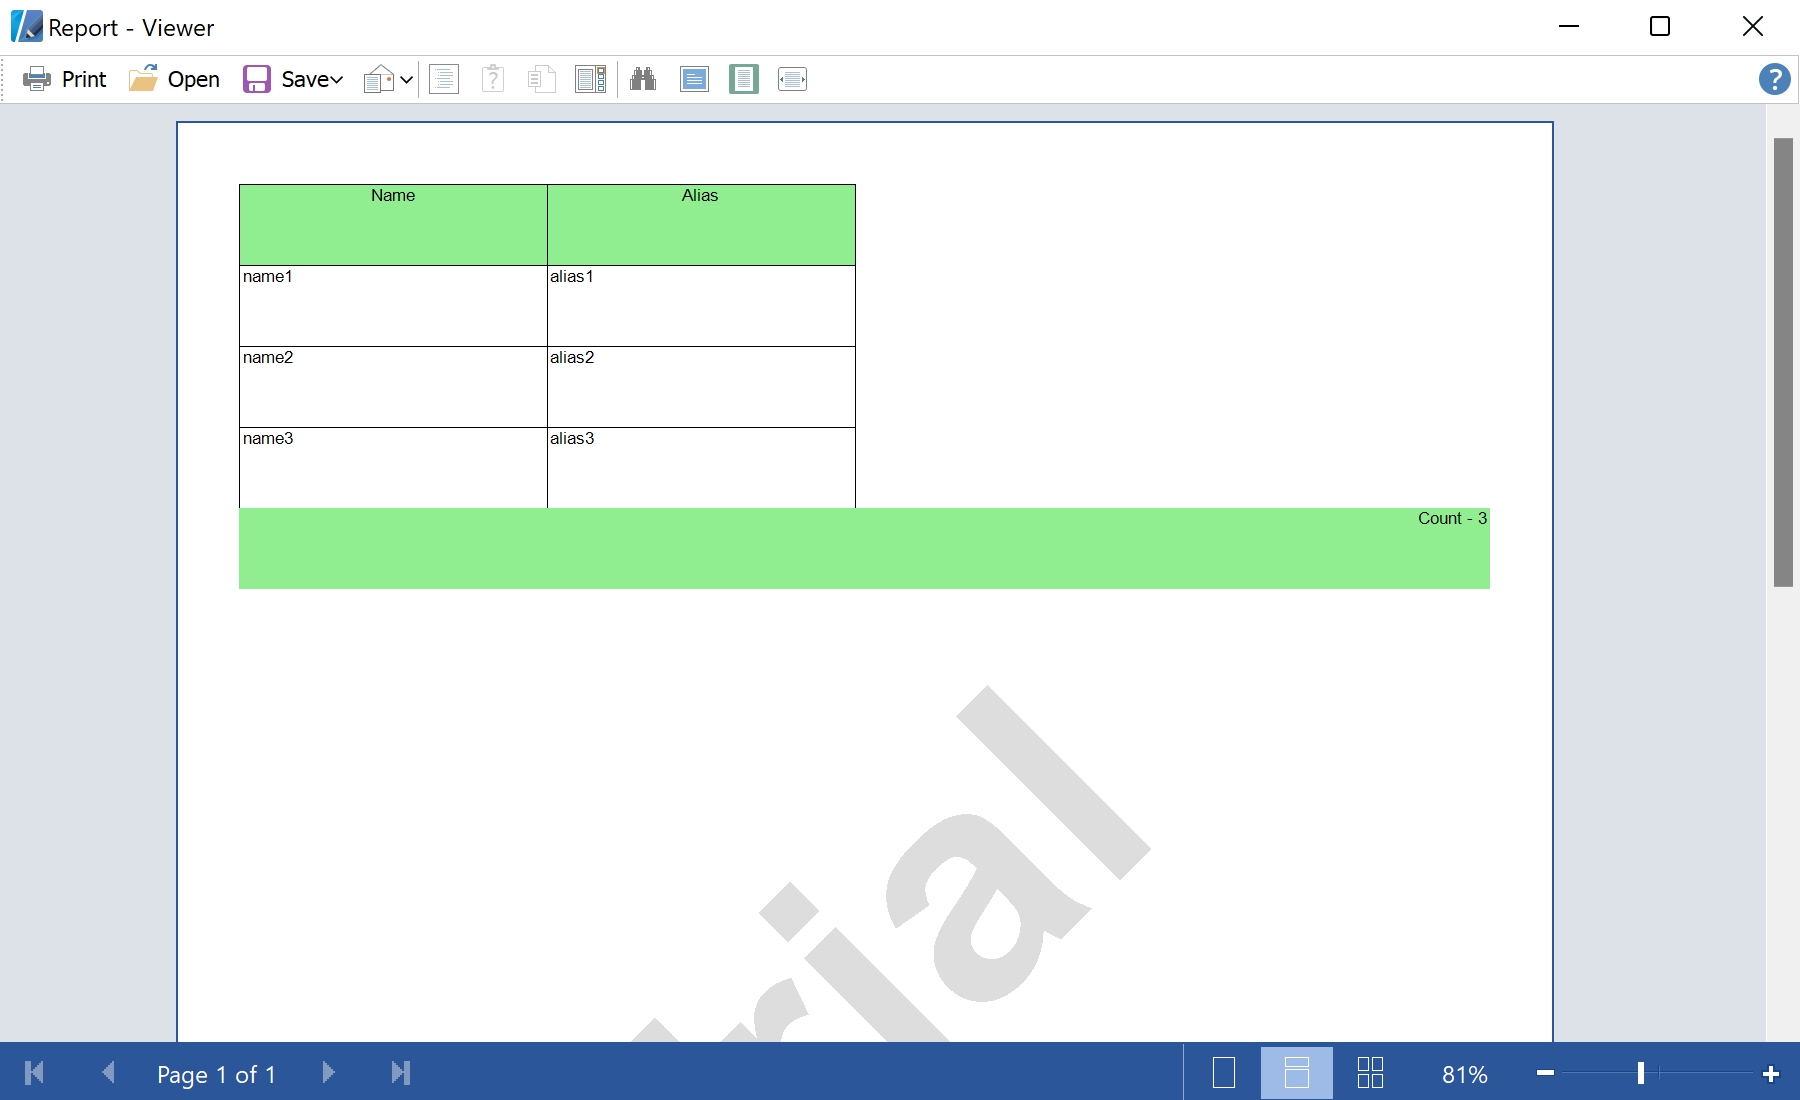
This example shows how to create a report with the Business Objects collection from code. Business Objects is an object class data with which the data can be presented in different structures: tables, lists, arrays, etc. The
FillBusinessObject() method creates and fills a data collection:
private ArrayList list = null;

private void FillBusinessObject()
{
	list = new ArrayList();
	list.Add(new BusinessEntity("name1", "alias1"));
	list.Add(new BusinessEntity("name2", "alias2"));
	list.Add(new BusinessEntity("name3", "alias3"));
}
Data is created, now you need to display it. At first, you should create a new report and data structure in the dictionary, transfer data to the dictionary from Business Object:
private void PrintDataGrid(DataGrid sender)
{
	StiReport report = new StiReport();
	report.ScriptLanguage = StiReportLanguageType.CSharp;

	// Add data to datastore
	report.RegData("MyList", list);

	// Fill dictionary
	report.Dictionary.Synchronize();
	StiPage page = report.Pages.Items[0];

...
Then you need to add the components to the report template. You should create the bands Header, Data and Footer. These bands are used to place the text boxes with text or references to the fields of the Business Object:
...

	// Create HeaderBand
	StiHeaderBand headerBand = new StiHeaderBand();
	headerBand.Name = "HeaderBand";
	page.Components.Add(headerBand);

	// Create Databand
	StiDataBand dataBand = new StiDataBand();
	dataBand.DataSourceName = "MyList";
	dataBand.Height = 0.5f;
	dataBand.Name = "DataBand";
	page.Components.Add(dataBand);

	StiDataSource dataSource = report.Dictionary.DataSources[0];

	// Create texts
	Double pos = 0;
	Double columnWidth = StiAlignValue.AlignToMinGrid(page.Width / dataSource.Columns.Count, 0.1, true);
	int nameIndex = 1;
	foreach (StiDataColumn column in dataSource.Columns)
	{
		if (column.Name == "_ID" || column.Name == "_Current") continue;

		// Create text on header
		StiText headerText = new StiText(new RectangleD(pos, 0, columnWidth, 0.5f));
		headerText.Text.Value = column.Name;
		headerText.HorAlignment = StiTextHorAlignment.Center;
		headerText.Name = "HeaderText" + nameIndex.ToString();
		headerText.Brush = new StiSolidBrush(Color.MediumSeaGreen);
		headerText.Border.Side = StiBorderSides.All;
		headerBand.Components.Add(headerText);

		// Create text on Data Band
		StiText dataText = new StiText(new RectangleD(pos, 0, columnWidth, 0.5f));
		dataText.Text.Value = "{MyList." + column.Name + "}";
		dataText.Name = "DataText" + nameIndex.ToString();
		dataText.Border.Side = StiBorderSides.All;

		dataBand.Components.Add(dataText);

		pos += columnWidth;

		nameIndex ++;
	}

	// Create FooterBand
	StiFooterBand footerBand = new StiFooterBand();
	footerBand.Height = 0.5f;
	footerBand.Name = "FooterBand";
	page.Components.Add(footerBand);

	// Create text on footer
	StiText footerText = new StiText(new RectangleD(0, 0, page.Width, 0.5f));
	footerText.Text.Value = "Count - {Count()}";
	footerText.HorAlignment = StiTextHorAlignment.Right;
	footerText.Name = "FooterText";
	footerText.Brush = new StiSolidBrush(Color.LightGreen);
	footerBand.Components.Add(footerText);

...
After this, you can render the report and show it in the viewer (or call the report designer):
...

	// Render without progress bar
	report.Render(false);

	report.Show();

	// For checking created report you can uncomment this line
	//report.Design();
}
Auf dem Screenshot unten Sie können das Ergebnis des Beispiel-Codes ansehen:
