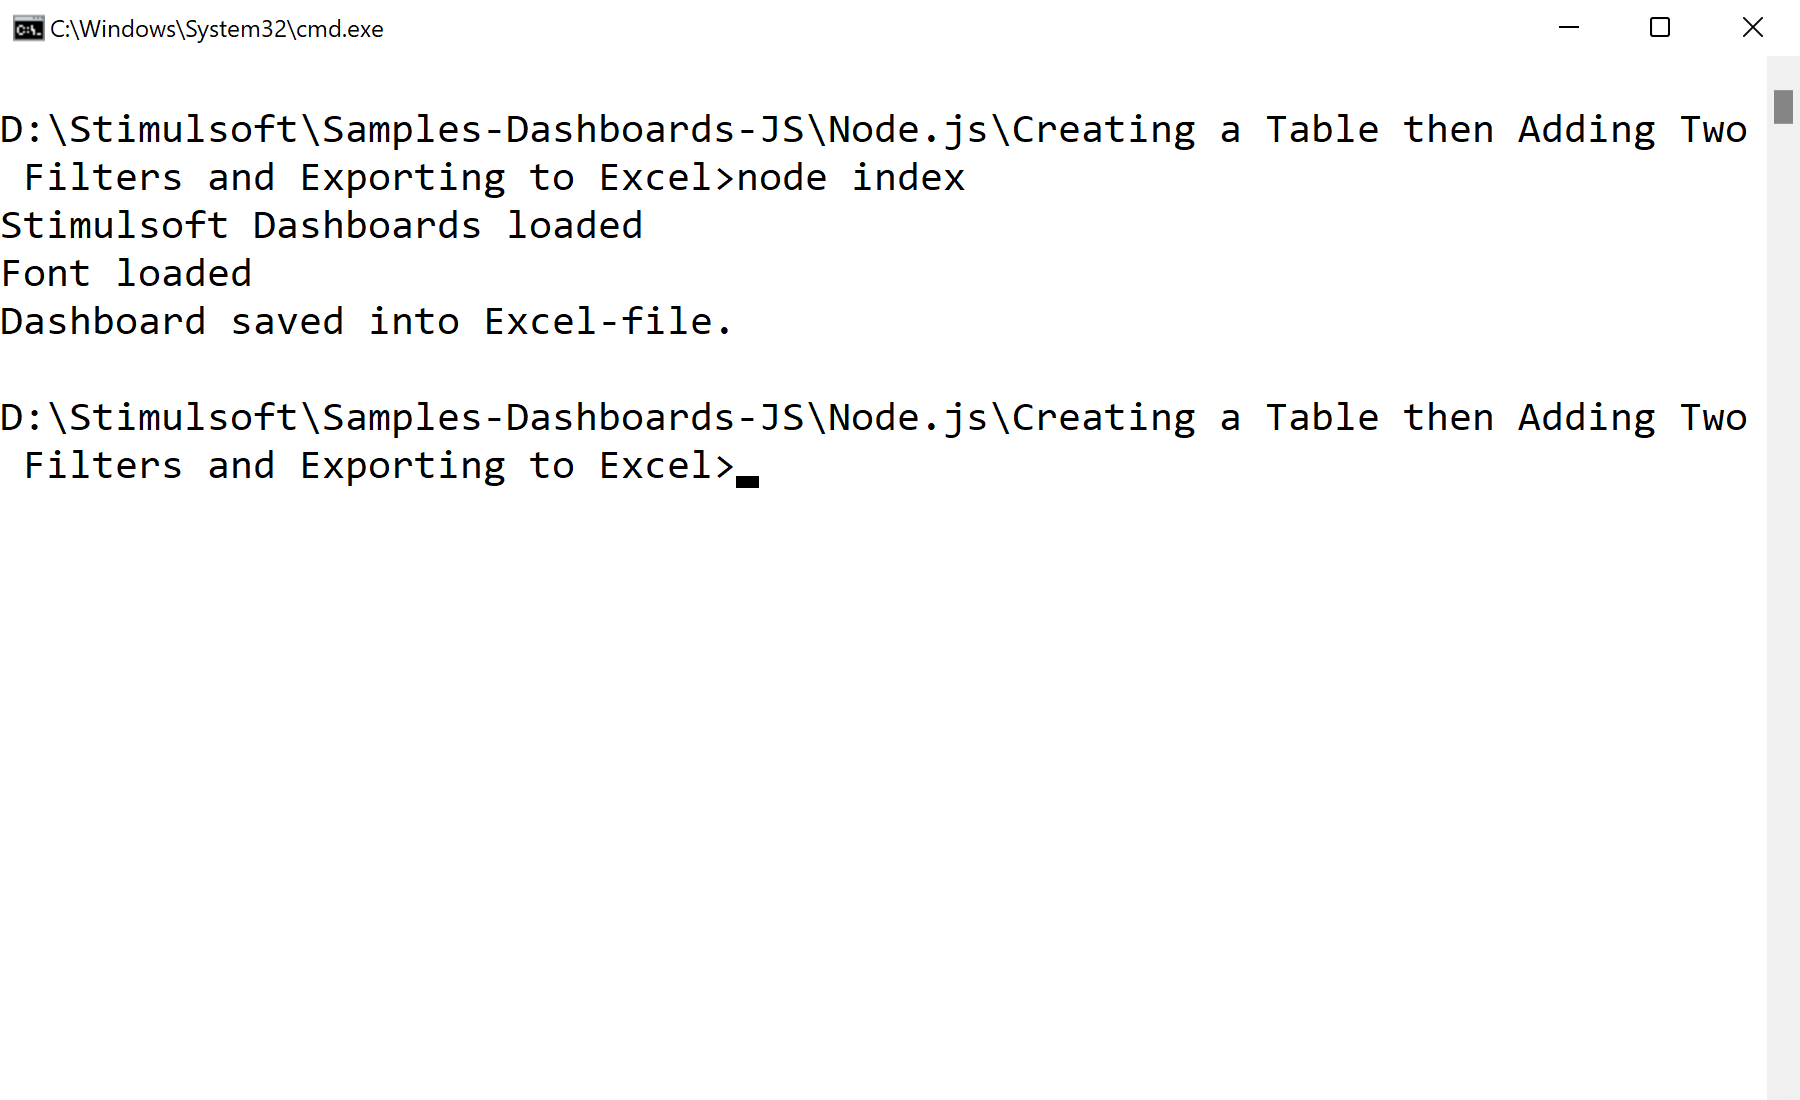
This example illustrates how to add a filter to the table element in the dashboard and store the result in the Excel file.
Installation and running
Use npm to install requred modules:
$ npm install
Run Sample:
$ npm start
Step by step
Stimulsoft Dashboards.JS module loading:
var Stimulsoft = require('stimulsoft-dashboards-js');
Creating new dashboard:
var report = Stimulsoft.Report.StiReport.createNewDashboard();
var dashboard = report.pages.getByIndex(0);
Load and add reg data:
var dataSet = new Stimulsoft.System.Data.DataSet();
dataSet.readXmlFile("Demo.xml");

report.regData("Demo", "Demo", dataSet);
report.dictionary.synchronize();
Create new table element:
var tableElement = new Stimulsoft.Dashboard.Components.Table.StiTableElement();
dashboard.components.add(tableElement);
Add column to table:
var productIDColumns = new Stimulsoft.Dashboard.Components.Table.StiDimensionColumn();
productIDColumns.expression = "Products.ProductID";
tableElement.columns.add(productIDColumns);
Add filter to table:
var productIDFilter = new Stimulsoft.Data.Engine.StiDataFilterRule();
productIDFilter.condition = Stimulsoft.Data.Engine.StiDataFilterCondition.BeginningWith;
productIDFilter.path = "Products.ProductID";
productIDFilter.value = "1";
tableElement.dataFilters.add(productIDFilter);
Export to Excel:
report.exportDocumentAsync((data) => {
    // Converting Array into buffer
    var buffer = Buffer.from(data)

    // File System module
    var fs = require('fs');

    //Saving to a file
    fs.writeFileSync('./SampleDashboard.xlsx', buffer);
}, Stimulsoft.Report.StiExportFormat.Excel2007);
Auf dem Screenshot unten Sie können das Ergebnis des Beispiel-Codes ansehen:
