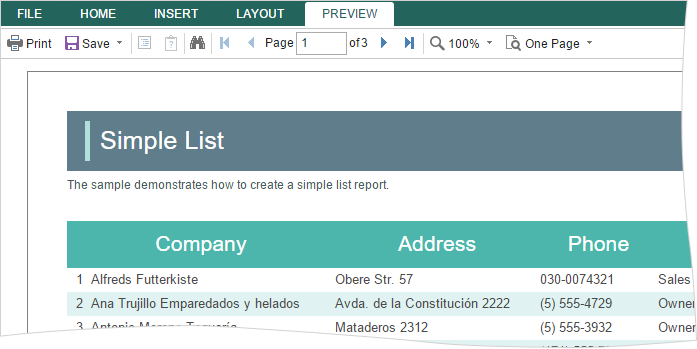
In the new version we have implemented the full-featured report preview in the JS designer. Previously, the preview only as HTML was available. Now, the preview does not differ from the report viewer and has all its functionality. Available are printing options, exporting the report to PDF, HTML, HTML5, Microsoft Word and Excel. Also, the preview tab may have the search bar, bookmarks and parameters. It also contains navigation, zooming controls, and page view modes.
UltimateDie Plattformen WinForms, WPF, ASP.NET (MVC, WebForms), .NET Core (MVC, Razor), Blazor (Server, Wasm), JavaScript, Node.js, Angular, PHP, Python, Java, Avalonia und verschiedene auf diesen Plattformen erstellten Frameworks werden unterstützt. Der Satz umfasst alle eingebetteten Lösungen für Berichte, Dashboards und Formulare. |
Reports.WEBASP.NET, MVC, .NET Core, Angular, Blazor |
Reports.NETWinForms, .NET Core, .NET, .NET Framework |
Reports.JSJavaScript, Node.js, Angular, React, Vue.js |
Reports.WPFWPF, .NET Framework, .NET Core, .NET |
Reports.PHPPHP 5, PHP 7, PHP 8 |
Reports.BLAZORBlazor Server, Blazor Wasm |
Reports.ANGULARAlle aktiv unterstützenden Versionen |
Reports.AVALONIA.NET 6+ |
Reports.PYTHONPython 3.10+, JavaScript |
Reports.JAVAJava™ SE 1.8+ |
Dashboards.WEBASP.NET, MVC, Blazor, .NET Core, .NET |
Dashboards.WINWinForms, WPF, .NET Core, .NET, .NET Framework |
Dashboards.JSJavaScript, Node.js, Angular, React, Vue.js |
Dashboards.PHPPHP 5, PHP 7, PHP 8 |
Dashboards.BLAZORBlazor Server, Blazor Wasm |
Dashboards.ANGULARAlle aktiv unterstützenden Versionen |
Dashboards.PYTHONPython 3.10+, JavaScript |
BI CloudCloud-Dienstleistung für schnelle und effektive Analyse und Visualisierung von Daten für Ihr Business ohne eigene Applikationen zu erstellen oder zu programmieren. |
BI DesignerPerfekte Lösung für Erstellen von Berichten und Dashboards auf dem Desktop. |
BI ServerVollständiger Client-Server-Komplex für Business Intelligence, der allen Benutzern die Möglichkeit anbietet, mit Berichten zu arbeiten und die Daten zu analysieren. |