We are pleased to announce the release of the new version Stimulsoft Reports 2017.1 which is now available for download. With this new version we introduce new features which are the new method of activating the software, .NET Core components in Reports.Web, ability to install Stimulsoft products using the NuGet, Maven, and NPM extensions, the Treemap chart, interactive charts in Reports.Web, and many more.
Activation of Stimulsoft products using a license key
Starting with the release 2017.1, activation of Stimulsoft products should be done using a license key. To do this, select the product in the user account, copy the activation code or download the file with the license key of the product, and use this key to activate the product.
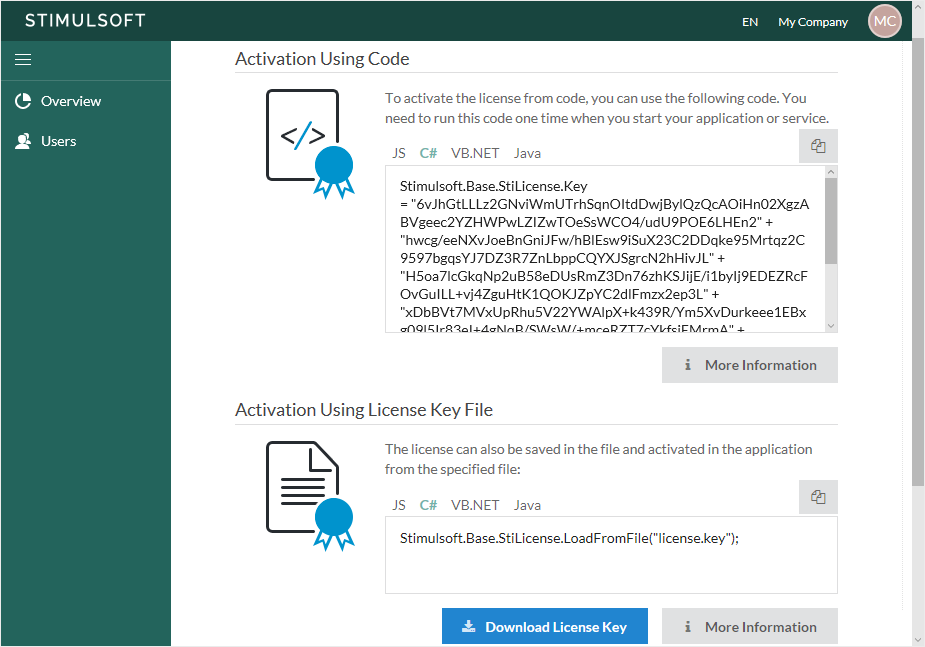
More detailed information about product activation using a license key and activation code is available in the user account.
Installing products using extensions
We have added the ability to install Stimulsoft products using the NuGet, Maven, and NPM extensions. Now being in the development environment, for example in Visual Studio, just select the Manage NuGet Packages... command in the context menu of the application, and then type Stimulsoft in the search field, specify the product, its version and click the Install button.
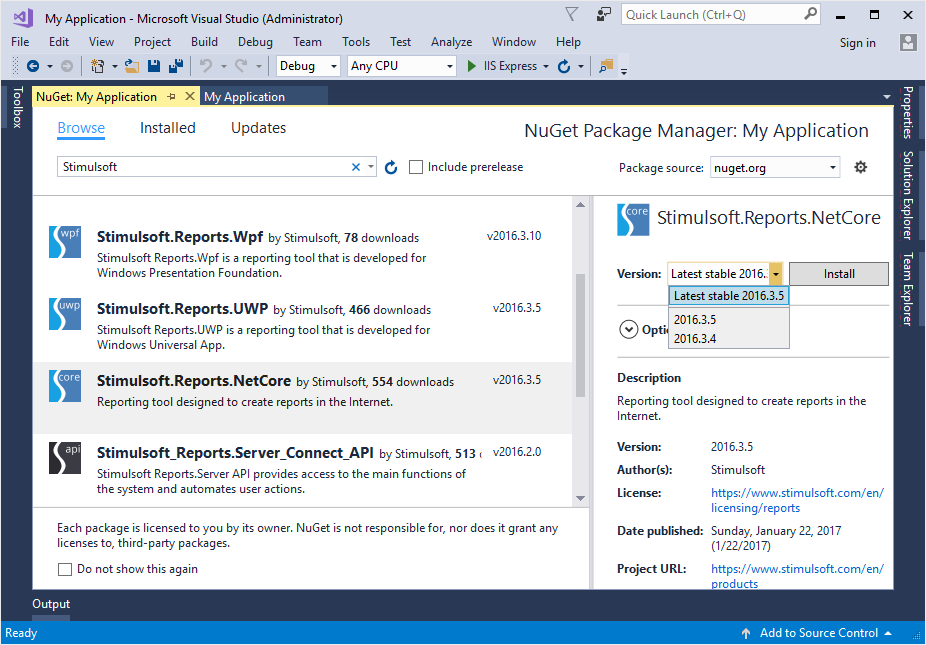
After that, the assemblies and components of the selected Stimulsoft product will be added to the custom project. You can add the Reports.Java product to your project using the Maven extension, and Reports.JS using the NPM extension, if the application is developed on Node.JS.
Support for .NET Core in Reports.Web
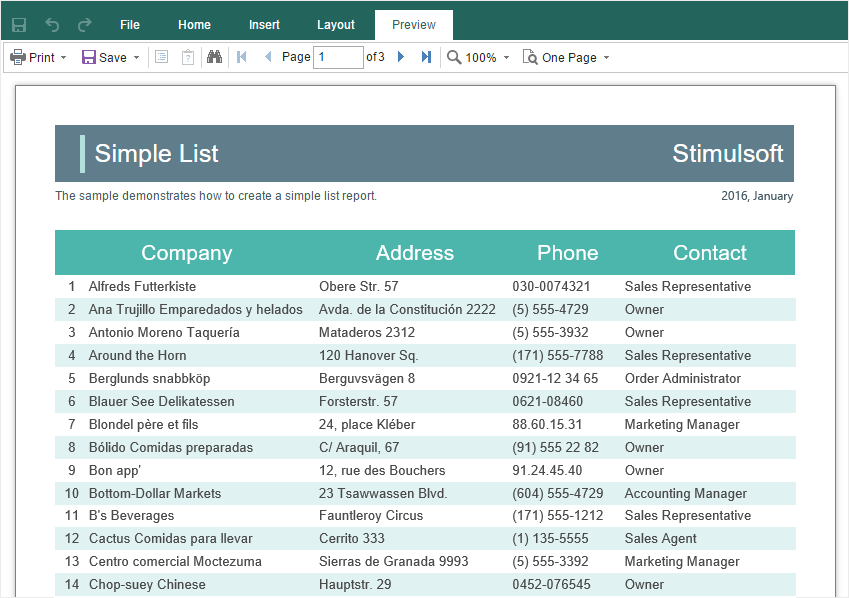
.NET Core is a cross-platform development technology. Starting with the release 2017.1, we added components for creating, editing and viewing reports using this technology. Net Core components are represented by a full-featured HTML5 viewer and report designer.
The TreeMap chart in Reports.Net, Reports.Web, Reports.Wpf
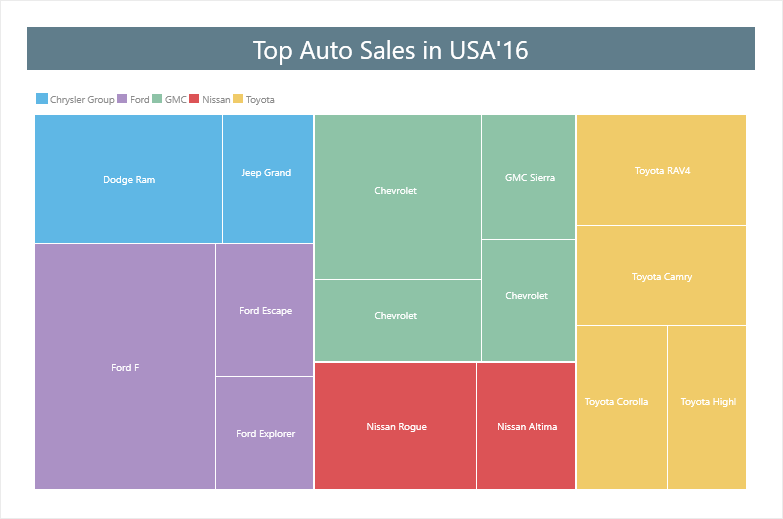
When designing reports for data visualization, you can now use the TreeMap chart. This diagram provides the ability to display a hierarchical view of the data.
The Anchor property in Reports.Net, Reports.Web, Reports.Wpf
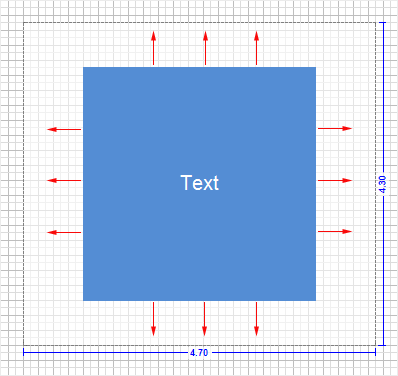
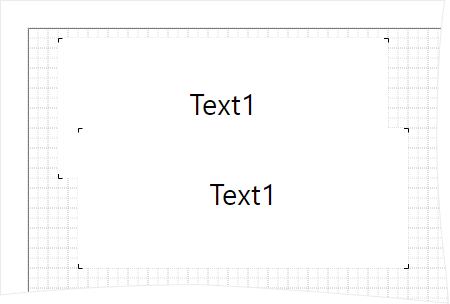
When a report component is placed on another one, you can set the anchors of the component. For example, if you place a text component on the panel, by default, the binding on the top and left borders is enabled. In this case, when you resize the panel, the top and left margins between the borders of the panel and the text component will remain unchanged. Also, you can set anchors on the bottom and right borders or by all four borders of the component. If the anchors of the top component are enabled for all borders, then its size will be proportionally changed to the size of the component that lies under the top component.
Interactive charts in Reports.Web
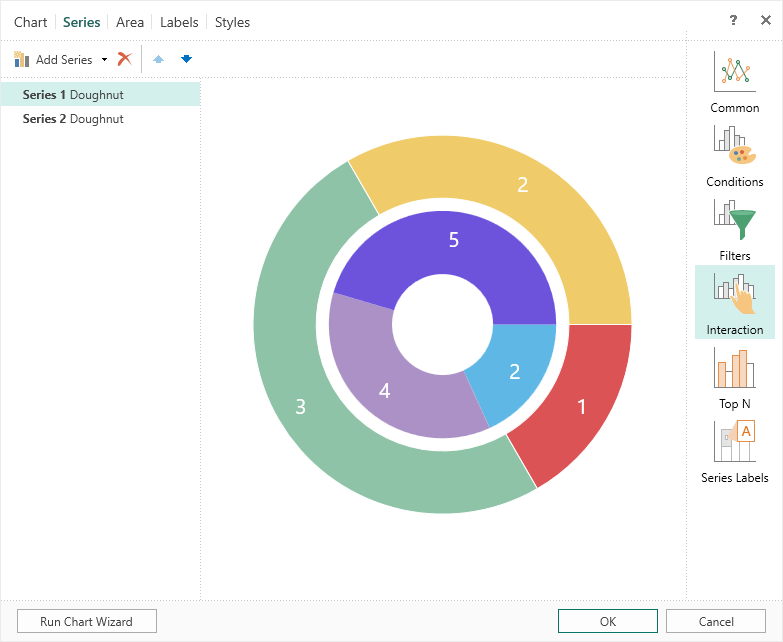
Starting with the release 2017.1, when developing reports, you can use the drill-down of the data in charts. Drill-down can be organized from a chart to a chart, from a chart to other report components, from other report components to a chart. To enable data drill-down, call the chart editor, go to the Interaction tab and specify the drill-down settings. The drill-down options from the chart to another report component, including another chart, are transferred using the Tag property.
The sum by a group for the map component in Reports.Web Reports.Net, Reports.Wpf
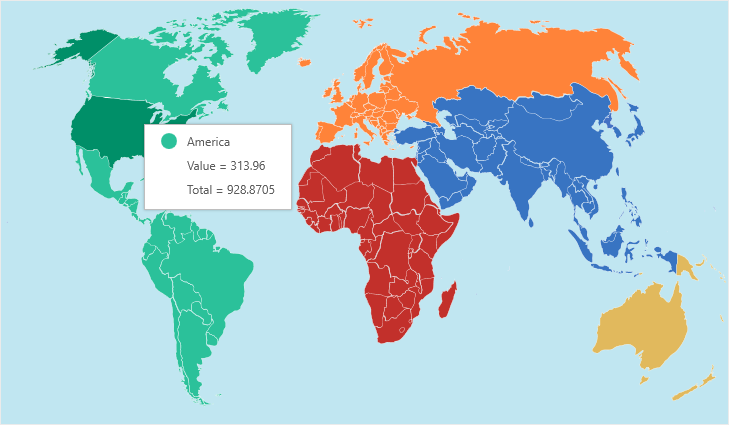
If you use the Map component in a report, you can group data, for example, by countries or by continents. In this case, when the cursor hovers over the map element, its name, value, and the sum of all values by the group to which this element belongs will be displayed.
Primitives in Reports.JS, Reports.Web
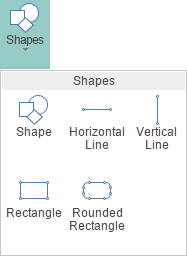
Primitives are one of the elements of graphic design in reports. In the release 2017.1, primitives are added to Reports.JS and Reports.Web. To add a horizontal, vertical line, rectangle, rounded rectangle to the report, go to the Insert tab, and, in the Shapes menu, select the corresponding element.
The Open button in the Reports.JS viewer
Starting with the release 2017.1, the Open button is added to the viewer. Using this option, you can load a previously rendered and saved report.
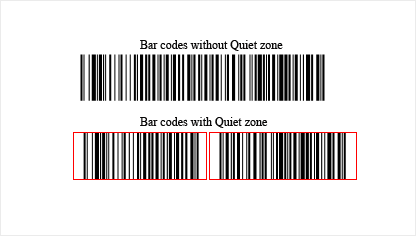
Quiet Zone in bar-codes in Reports.JS, Reports.Web
The quiet zone is the bar-code separator for the bar-code reader. Now when creating reports, you can enable or disable the quiet zone of the bar-code.
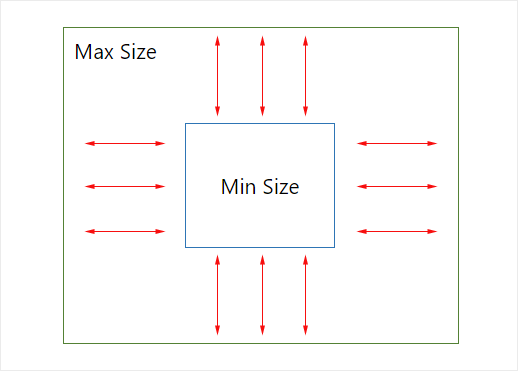
New properties to resize components in Reports.JS, Reports.Web
We added the ability to specify the maximum and minimum sizes of report components by height and width. When rendering reports, the component can grow to the maximum values or can decrease to the minimum values. By default, the size of a component is unlimited.
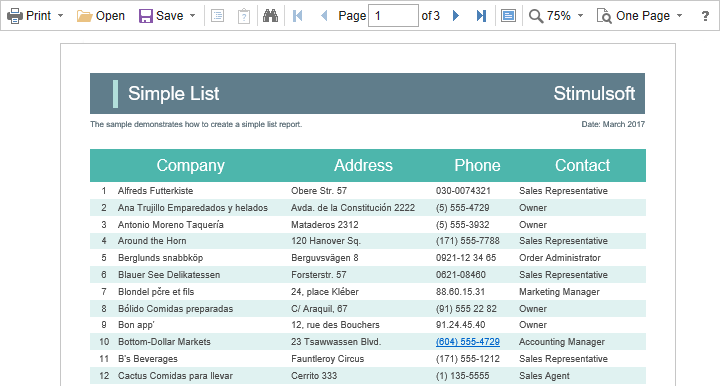
XSD schema in Reports.Java
Previously, the structure for XML data could only be obtained from an XSD file. Starting with the release 2017.1, you can also get a structure for the XML data source from another XML file.
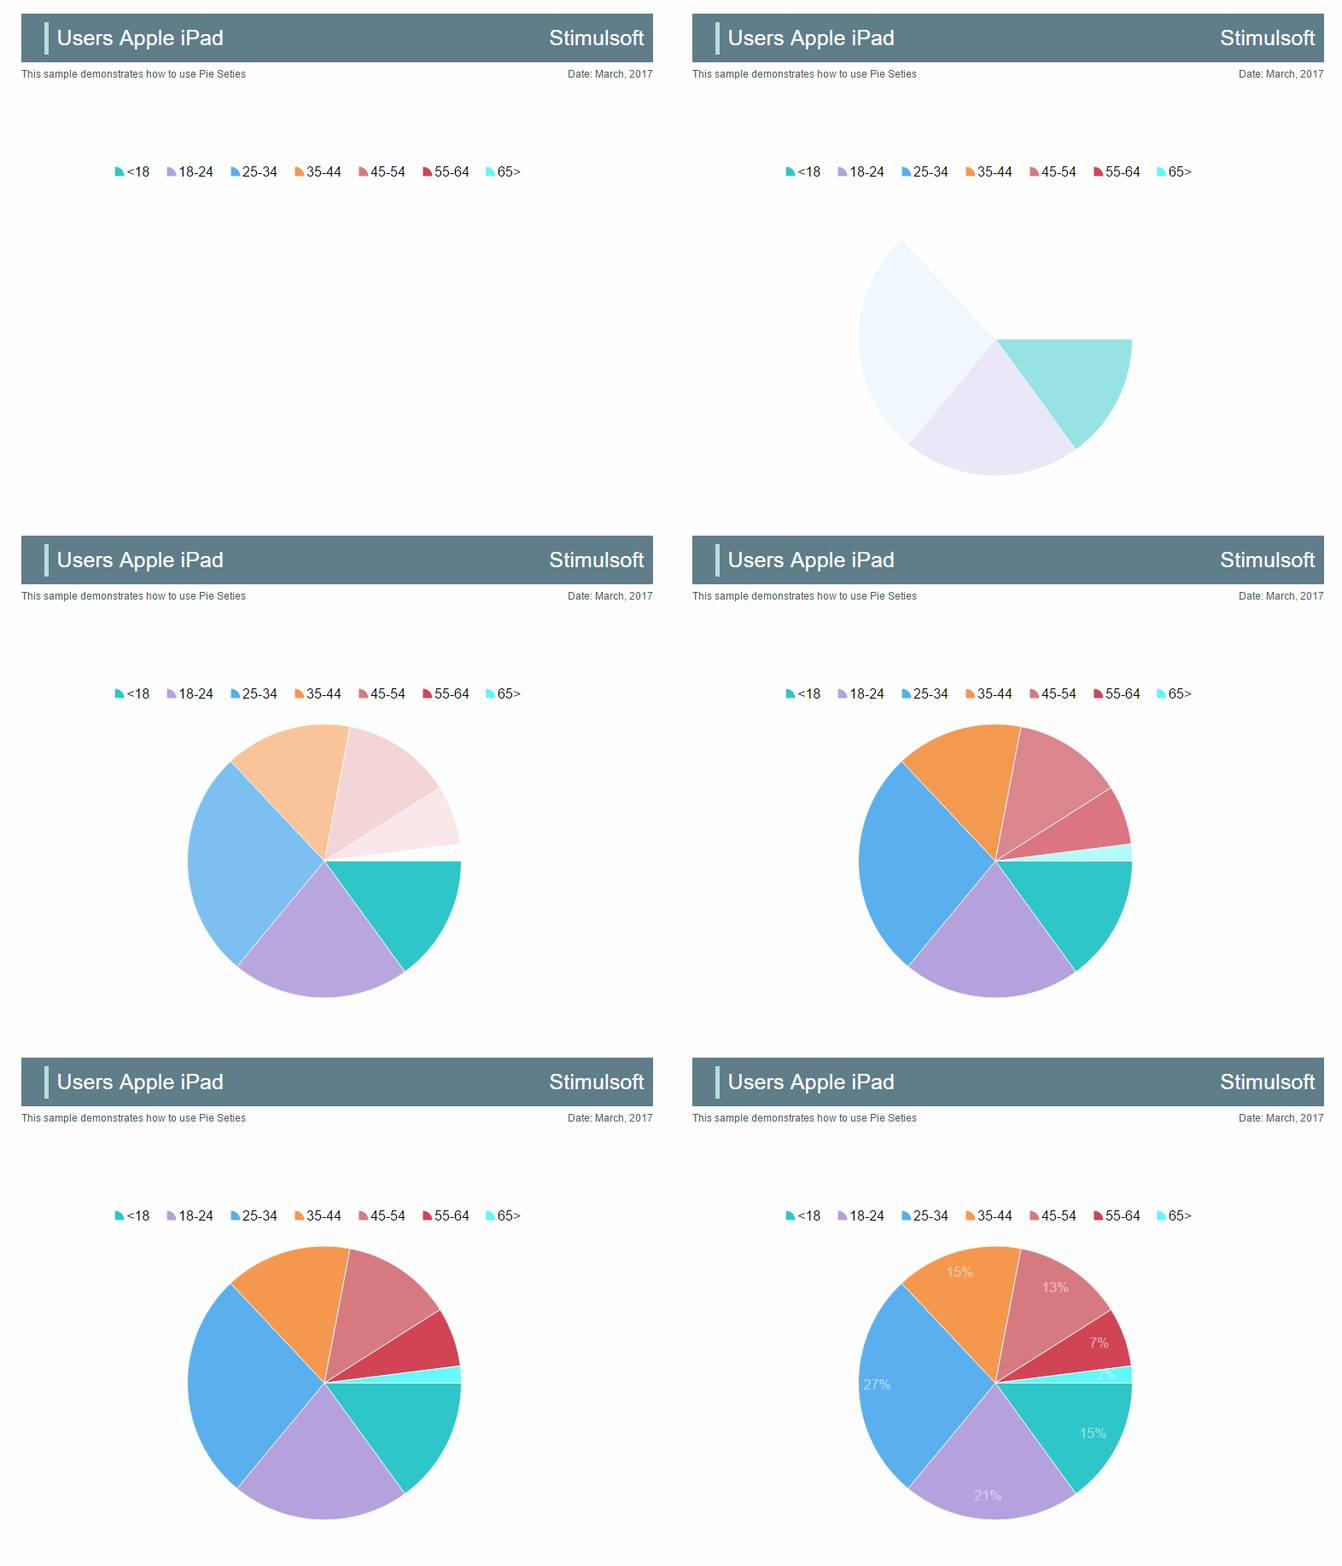
Animation of charts is Reports.Java
In the release 2017.1, we have added the animation of charts. This feature increases the attractiveness of reports with charts.
New exports in Reports.Java
Starting with the release 2017.1, reports can be converted to such types of documents as OpenDocumnet Calc and OpenDocumentWriter. For this, in the viewer or the preview tab, select the appropriate item in the Save menu, define the export settings and click the OK button to export the report.
Copying components in Reports.Java
One of the ways to copy components can be applied by using the Ctrl key. To do this, select the component, hold down the Ctrl key and do not release it. Drag the component. In this case, the component itself and all other components that are located on it will be copied.
Conditions for styles in Reports.Java
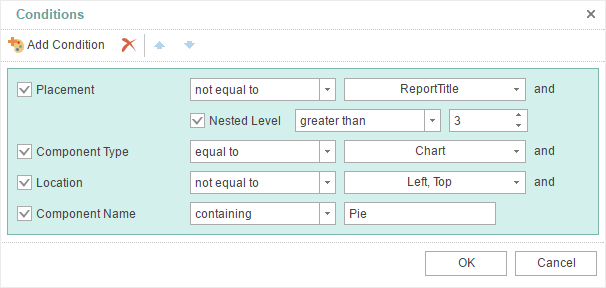
By default, the styles from the list are applied sequentially to the report components. If you use a collection of styles, the last style of the collection will be applied to the report components. However, when using the style conditions, you can define the settings by which this style will be applied. A condition can be specified depending on the position, type, location, or name of the component to which this style will be applied. The number of conditions for the same style is unlimited.
New themes for the Reports.JS, Reports.Web, and Reports.PHP viewers
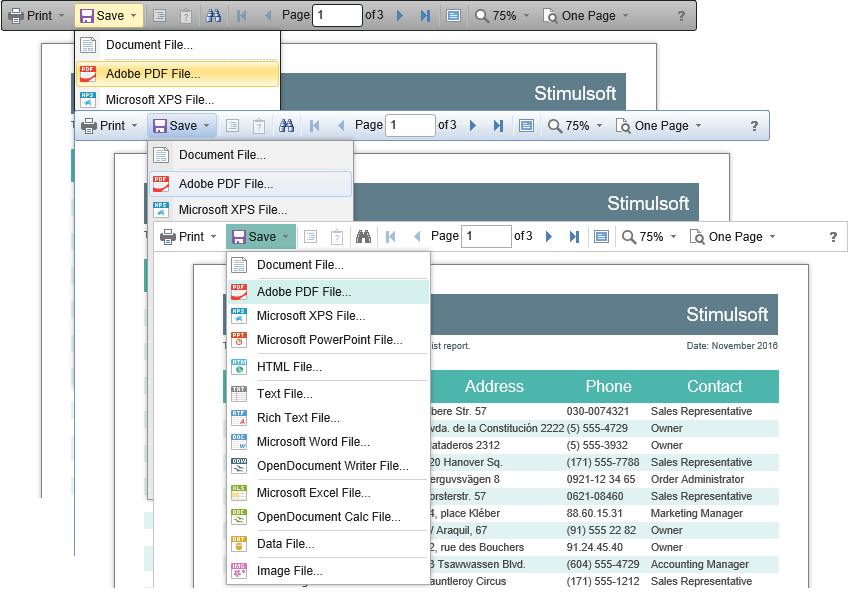
In the release 2017.1, 21 themes for the HTML5 viewer are added. This provides the ability to setup the appearance of the viewer.
Mirror fields in Reports.Java
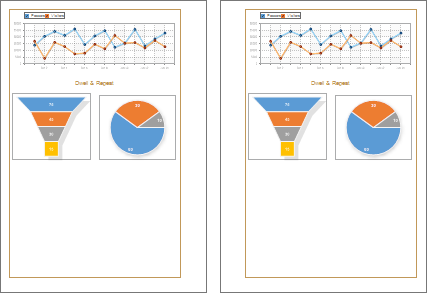
Now you can create reports with binding. We added support for mirror fields. To enable mirroring mode, set the Mirror Margins property to true.
New parameters of the data dictionary in Reports.Java
In the release 2017.1, two parameters have been added in the data dictionary - Create Label and Create Field on Double Click.

Activation of Stimulsoft products using a license key
Starting with the release 2017.1, activation of Stimulsoft products should be done using a license key. To do this, select the product in the user account, copy the activation code or download the file with the license key of the product, and use this key to activate the product.

More detailed information about product activation using a license key and activation code is available in the user account.
Installing products using extensions
We have added the ability to install Stimulsoft products using the NuGet, Maven, and NPM extensions. Now being in the development environment, for example in Visual Studio, just select the Manage NuGet Packages... command in the context menu of the application, and then type Stimulsoft in the search field, specify the product, its version and click the Install button.

After that, the assemblies and components of the selected Stimulsoft product will be added to the custom project. You can add the Reports.Java product to your project using the Maven extension, and Reports.JS using the NPM extension, if the application is developed on Node.JS.
Support for .NET Core in Reports.Web
.NET Core is a cross-platform development technology. Starting with the release 2017.1, we added components for creating, editing and viewing reports using this technology. Net Core components are represented by a full-featured HTML5 viewer and report designer.

The TreeMap chart in Reports.Net, Reports.Web, Reports.Wpf
When designing reports for data visualization, you can now use the TreeMap chart. This diagram provides the ability to display a hierarchical view of the data.

The Anchor property in Reports.Net, Reports.Web, Reports.Wpf
When a report component is placed on another one, you can set the anchors of the component. For example, if you place a text component on the panel, by default, the binding on the top and left borders is enabled. In this case, when you resize the panel, the top and left margins between the borders of the panel and the text component will remain unchanged. Also, you can set anchors on the bottom and right borders or by all four borders of the component. If the anchors of the top component are enabled for all borders, then its size will be proportionally changed to the size of the component that lies under the top component.

Interactive charts in Reports.Web
Starting with the release 2017.1, when developing reports, you can use the drill-down of the data in charts. Drill-down can be organized from a chart to a chart, from a chart to other report components, from other report components to a chart. To enable data drill-down, call the chart editor, go to the Interaction tab and specify the drill-down settings. The drill-down options from the chart to another report component, including another chart, are transferred using the Tag property.

The sum by a group for the map component in Reports.Web Reports.Net, Reports.Wpf
If you use the Map component in a report, you can group data, for example, by countries or by continents. In this case, when the cursor hovers over the map element, its name, value, and the sum of all values by the group to which this element belongs will be displayed.

Primitives in Reports.JS, Reports.Web
Primitives are one of the elements of graphic design in reports. In the release 2017.1, primitives are added to Reports.JS and Reports.Web. To add a horizontal, vertical line, rectangle, rounded rectangle to the report, go to the Insert tab, and, in the Shapes menu, select the corresponding element.

The Open button in the Reports.JS viewer
Starting with the release 2017.1, the Open button is added to the viewer. Using this option, you can load a previously rendered and saved report.

Quiet Zone in bar-codes in Reports.JS, Reports.Web
The quiet zone is the bar-code separator for the bar-code reader. Now when creating reports, you can enable or disable the quiet zone of the bar-code.

New properties to resize components in Reports.JS, Reports.Web
We added the ability to specify the maximum and minimum sizes of report components by height and width. When rendering reports, the component can grow to the maximum values or can decrease to the minimum values. By default, the size of a component is unlimited.

XSD schema in Reports.Java
Previously, the structure for XML data could only be obtained from an XSD file. Starting with the release 2017.1, you can also get a structure for the XML data source from another XML file.
Animation of charts is Reports.Java
In the release 2017.1, we have added the animation of charts. This feature increases the attractiveness of reports with charts.

New exports in Reports.Java
Starting with the release 2017.1, reports can be converted to such types of documents as OpenDocumnet Calc and OpenDocumentWriter. For this, in the viewer or the preview tab, select the appropriate item in the Save menu, define the export settings and click the OK button to export the report.
Copying components in Reports.Java
One of the ways to copy components can be applied by using the Ctrl key. To do this, select the component, hold down the Ctrl key and do not release it. Drag the component. In this case, the component itself and all other components that are located on it will be copied.

Conditions for styles in Reports.Java
By default, the styles from the list are applied sequentially to the report components. If you use a collection of styles, the last style of the collection will be applied to the report components. However, when using the style conditions, you can define the settings by which this style will be applied. A condition can be specified depending on the position, type, location, or name of the component to which this style will be applied. The number of conditions for the same style is unlimited.

New themes for the Reports.JS, Reports.Web, and Reports.PHP viewers
In the release 2017.1, 21 themes for the HTML5 viewer are added. This provides the ability to setup the appearance of the viewer.

Mirror fields in Reports.Java
Now you can create reports with binding. We added support for mirror fields. To enable mirroring mode, set the Mirror Margins property to true.

New parameters of the data dictionary in Reports.Java
In the release 2017.1, two parameters have been added in the data dictionary - Create Label and Create Field on Double Click.
