We are pleased to announce the new version of Stimulsoft Reports 2015.3. One of the most important changes implemented is that Reports.PHP was substantially reengineered and can work now on the JS report engine. Also we would like to announce the new Map component integrated in Reports.Wpf, bar-codes and images as primitives, touch UI in Reports.Java, support for WebSphere 5 & IBM Java SDK by Reports.Java, etc. Reports.JS functionality was extended on integrating the Bar-code component, UI localizations in more that 30 languages, support for Firebird, MS SQL and MySQL database adapters for Node.js and PHP etc.
JS Report Engine in Reports.PHP
Until now, the reporting tool Reports.PHP was based on the Flash technology. Appropriately, it had all the advantages of this technology and disadvantages as well. One of the most significant limitations was the need to install the Flash Player and there was no ability to use the product in many mobile devices such as tablets, phones, etc.

In the release 2015.3 of Reports.PHP in addition to the Fx Report Engine, which is based on the Flash technology, we added JavaScript Report Engine, which is completely designed using the JavaScript language. Now Reports.PHP contains the HTML5 viewer and designer and is not limited in Flash technology.
Maps in Reports.Wpf
This is the new data visualization tool in the release 2015.3. Everybody knows that information is perceived better and easier if it is visualized. Using the map component, it is possible to visualize geographical data. For example, any geographical area can be painted in a specific color and are grouped according to a certain condition. Also the Map component supports tooltips that display the name of the geographical area and can also show the value.
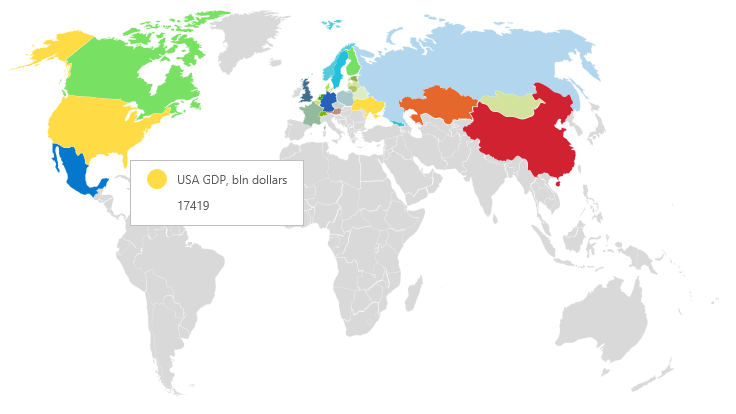
Using maps in reports as a separate element as well as connected with other elements provides the ability to create reports easier in perception.
Variable in Queries
Parameters are used when creating a query for getting data. Previously, in order to use the variable from the report dictionary as a parameter in the request, you needed to create a variable first. Then, when editing the data source to create a setting in the data source you needed to specify the variable as the value of this parameter and to register this parameter in the text query.
In the 2015.3 release of Reports.Net and Reports.Wpf, we have made use of variables in queries easier. When you create a variable, you should set the flag Allow using as SQL parameter.
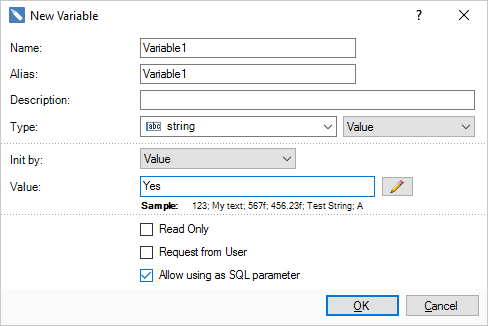
Next, when editing the data source, you should register the name of the variable in the query, using a special character "@" at the beginning of the name.

Then click OK. And the variable will present in the data source and is used as a parameter in the query.
Extended Text Formatting
In previous versions the format of the text could be defined using local settings. The text was formatted according to the current settings of the operating system or by defining each parameter manually in the format mask. And in fact, in both cases there were some inconveniences. For example, in order to change local settings you needed to edit formats of the operating system. In the second case, in order to change one parameter you needed to adjust others as well. After a deep analysis of the situation, taking into account the wishes and suggestions of our users, we have added the ability to change settings selectively using local settings. This feature is available in Reports.Web, Reports.Wpf and Reports.Net.
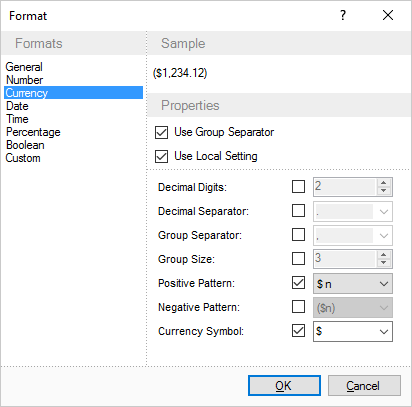
As can be seen from the picture abobe, the local formatting options are used. Thus, the values of Positive Pattern and Currency Symbol are changed.
Drag&Drop Components in HTML5 Designer
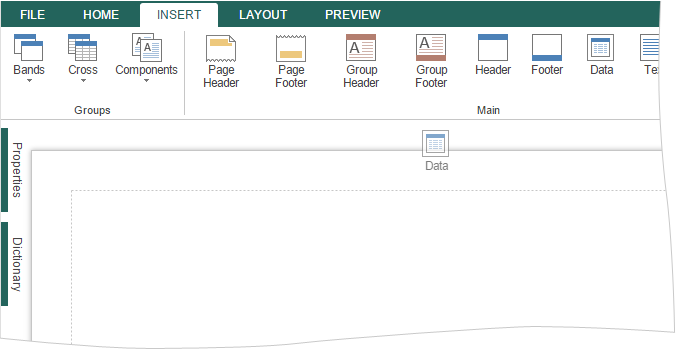
The HTML5 report designer of Reports.Web now has the ability to drag components from the Insert tab directly into a report template. This greatly simplifies the work of the designer in a mobile device. You need to just define a component, click on it hold on the pointer and drag on the page in the report.
Primitives When Exporting to PDF and SVG
In previous versions Bar-code components and Shapes when exporting to PDF or SVG, were converted into an image. This in turn increased the size of the document. Srating from the release of 2015.3 in products Reports.Net, Reports.Wpf and Reports.Web all bar-codes and shapes are exported as primitives.
New Styles for Charts and Gauges
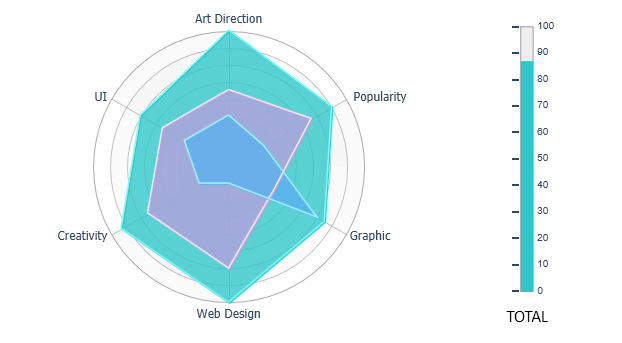
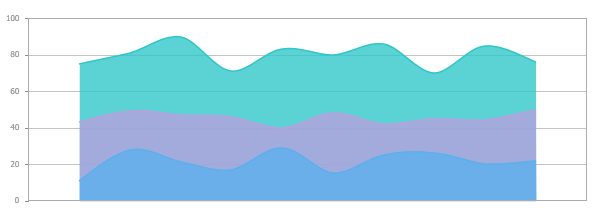
The style of the report affects on how information visually looks in the report. This is especially important when it comes to graphic components. In the 2015.3 release of Reports.Web, Reports.Wpf and Reports.Net we have added new styles for data visualization of components such as charts and gauges.

Data Sources in Reports.JS
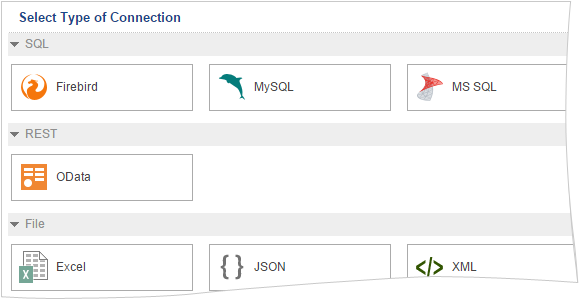
In the release 2015.3, the data can be obtained from the OData data source or Excel file. In addition, it supports Firebird, MS SQL and MySQL database adapters for Node.js and PHP.
Variables in Reports.JS
Now you can use the variables in the report, for example, for filtering data or for specifying the variable as the value of parameters in the data queries.
Expressions for JSON and XML in Reports.JS
When creating a SQL data source it is permitted to use parameters and expressions for the data retrieval. If the data source did not supported SQL queries then this opportunity was absent. In the release 2015.3 we have added support for expressions to create JSON or XML data source which can now be used in the path to the data file. The result of this expression will be used as a parameter of data selection. Also in expressions you can use in report variables. To do this, create a variable and add the corresponding expression in the path to the data source.
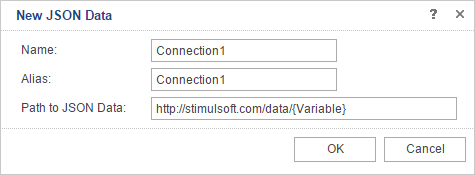
Depending on the variable value data selection will be done.
Bar-Codes in Reports.JS
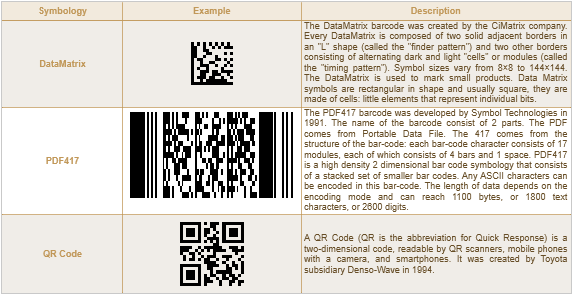
We have added the Barcode component into the reporting tool for JavaScript. It supports more than 30 types of bar-codes, including very popular QR-code.
Localization of Reports.JS UI
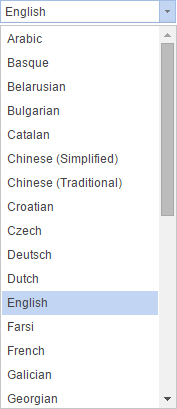
In the release 2015.3 a list of available UI localizations for the viewer and designer was extended. Enter the designer and select the required locale of the user interface. Around 30 languages are supported.
Dependent Variables in Reports.Java
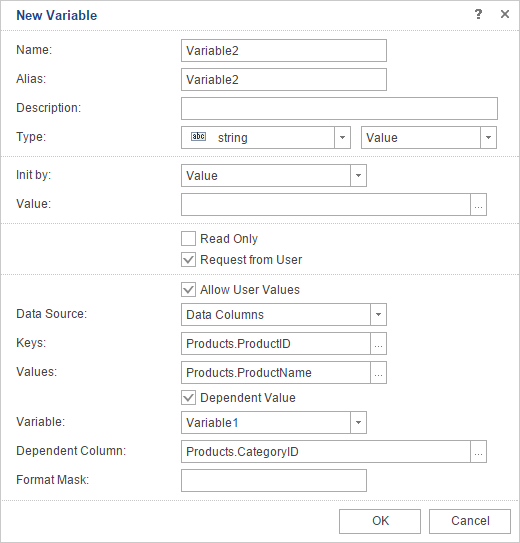
The HTML viewer adds support for the dependent variables. Now you can create a hierarchy of variables in the designer by filtering data, for example, in Master-Detail reports.
Dynamic Collapsing in Reports.Java
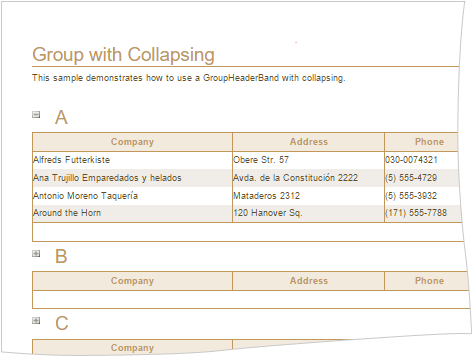
Dynamic collapsing is now available in the HTML viewer. Using this feature, you can expand and collapse lists and groups in the viewer. For example, there is a report with grouping, and dynamic collapsing is enabled for the group headers. In this case, clicking on the header of the group will expand it, or hide, depending on the initial conditions.
Touch Interface in Reports.Java
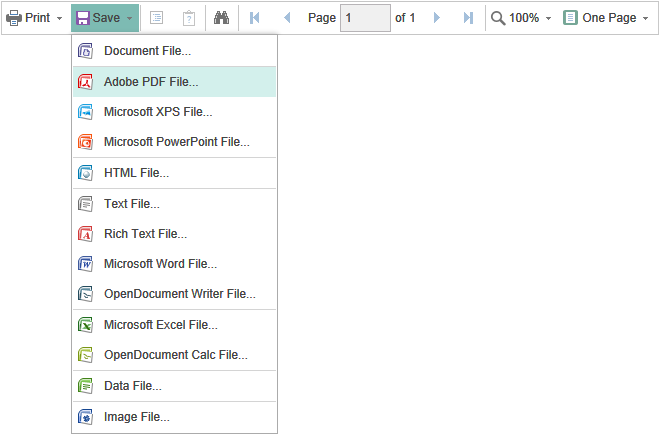
In order to work in the viewer on a mobile device the Touch interface must be supported. Starting from the release of 2015.3 the HTML viewer fully supports the Touch interface. Now you can easily view reports, navigate through them, export, send by Email and all this can be done from your mobile device.
Interactive Sorting in Reports.Java
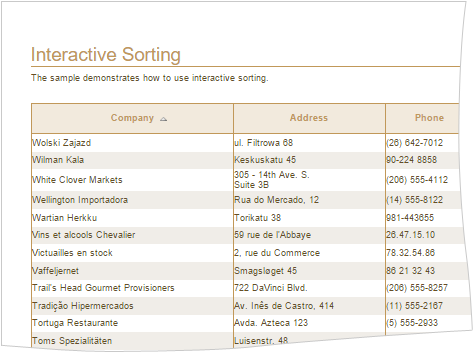
Interactive sorting involves the ability to sort the data in the viewer. By clicking on the components with enabled sorting you can change the order of data output.
New Themes in Reports.Java
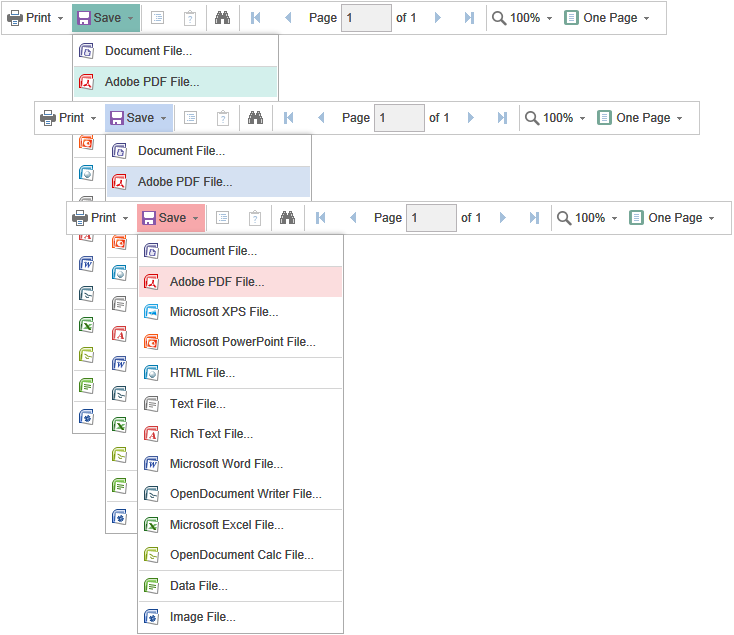
We added color schemes and MS Office 2013 UI themes in the HTML viewer.
WebSphere 5 & IBM Java SDK
One of the most flexible and productive environments for Java web applications is a WebSphere Application Server (WAS) from the IBM company. In the release of 2015.3, the reporting tool Reports.Java supports WebSphere 5 & IBM Java SDK.
By the links below you can see the full list of changes and download the latest version of the products
Stimulsoft Reports.Ultimate
Stimulsoft Reports.Net
Stimulsoft Reports.Silverlight
Stimulsoft Reports.Web
Stimulsoft Reports.Wpf
Stimulsoft Reports.WinRT
Stimulsoft Reports.JS
Stimulsoft Reports.Flex
Stimulsoft Reports.PHP
Stimulsoft Reports.Java
Stimulsoft Reports Server
In addition, we have prepared some Christmas Presents for you.
JS Report Engine in Reports.PHP
Until now, the reporting tool Reports.PHP was based on the Flash technology. Appropriately, it had all the advantages of this technology and disadvantages as well. One of the most significant limitations was the need to install the Flash Player and there was no ability to use the product in many mobile devices such as tablets, phones, etc.

In the release 2015.3 of Reports.PHP in addition to the Fx Report Engine, which is based on the Flash technology, we added JavaScript Report Engine, which is completely designed using the JavaScript language. Now Reports.PHP contains the HTML5 viewer and designer and is not limited in Flash technology.
Maps in Reports.Wpf
This is the new data visualization tool in the release 2015.3. Everybody knows that information is perceived better and easier if it is visualized. Using the map component, it is possible to visualize geographical data. For example, any geographical area can be painted in a specific color and are grouped according to a certain condition. Also the Map component supports tooltips that display the name of the geographical area and can also show the value.

Using maps in reports as a separate element as well as connected with other elements provides the ability to create reports easier in perception.
Variable in Queries
Parameters are used when creating a query for getting data. Previously, in order to use the variable from the report dictionary as a parameter in the request, you needed to create a variable first. Then, when editing the data source to create a setting in the data source you needed to specify the variable as the value of this parameter and to register this parameter in the text query.
In the 2015.3 release of Reports.Net and Reports.Wpf, we have made use of variables in queries easier. When you create a variable, you should set the flag Allow using as SQL parameter.

Next, when editing the data source, you should register the name of the variable in the query, using a special character "@" at the beginning of the name.

Then click OK. And the variable will present in the data source and is used as a parameter in the query.
Extended Text Formatting
In previous versions the format of the text could be defined using local settings. The text was formatted according to the current settings of the operating system or by defining each parameter manually in the format mask. And in fact, in both cases there were some inconveniences. For example, in order to change local settings you needed to edit formats of the operating system. In the second case, in order to change one parameter you needed to adjust others as well. After a deep analysis of the situation, taking into account the wishes and suggestions of our users, we have added the ability to change settings selectively using local settings. This feature is available in Reports.Web, Reports.Wpf and Reports.Net.

As can be seen from the picture abobe, the local formatting options are used. Thus, the values of Positive Pattern and Currency Symbol are changed.
Drag&Drop Components in HTML5 Designer
The HTML5 report designer of Reports.Web now has the ability to drag components from the Insert tab directly into a report template. This greatly simplifies the work of the designer in a mobile device. You need to just define a component, click on it hold on the pointer and drag on the page in the report.

Primitives When Exporting to PDF and SVG
In previous versions Bar-code components and Shapes when exporting to PDF or SVG, were converted into an image. This in turn increased the size of the document. Srating from the release of 2015.3 in products Reports.Net, Reports.Wpf and Reports.Web all bar-codes and shapes are exported as primitives.
New Styles for Charts and Gauges
The style of the report affects on how information visually looks in the report. This is especially important when it comes to graphic components. In the 2015.3 release of Reports.Web, Reports.Wpf and Reports.Net we have added new styles for data visualization of components such as charts and gauges.


Data Sources in Reports.JS
In the release 2015.3, the data can be obtained from the OData data source or Excel file. In addition, it supports Firebird, MS SQL and MySQL database adapters for Node.js and PHP.

Variables in Reports.JS
Now you can use the variables in the report, for example, for filtering data or for specifying the variable as the value of parameters in the data queries.
Expressions for JSON and XML in Reports.JS
When creating a SQL data source it is permitted to use parameters and expressions for the data retrieval. If the data source did not supported SQL queries then this opportunity was absent. In the release 2015.3 we have added support for expressions to create JSON or XML data source which can now be used in the path to the data file. The result of this expression will be used as a parameter of data selection. Also in expressions you can use in report variables. To do this, create a variable and add the corresponding expression in the path to the data source.

Depending on the variable value data selection will be done.
Bar-Codes in Reports.JS
We have added the Barcode component into the reporting tool for JavaScript. It supports more than 30 types of bar-codes, including very popular QR-code.

Localization of Reports.JS UI
In the release 2015.3 a list of available UI localizations for the viewer and designer was extended. Enter the designer and select the required locale of the user interface. Around 30 languages are supported.

Dependent Variables in Reports.Java
The HTML viewer adds support for the dependent variables. Now you can create a hierarchy of variables in the designer by filtering data, for example, in Master-Detail reports.

Dynamic Collapsing in Reports.Java
Dynamic collapsing is now available in the HTML viewer. Using this feature, you can expand and collapse lists and groups in the viewer. For example, there is a report with grouping, and dynamic collapsing is enabled for the group headers. In this case, clicking on the header of the group will expand it, or hide, depending on the initial conditions.

Touch Interface in Reports.Java
In order to work in the viewer on a mobile device the Touch interface must be supported. Starting from the release of 2015.3 the HTML viewer fully supports the Touch interface. Now you can easily view reports, navigate through them, export, send by Email and all this can be done from your mobile device.

Interactive Sorting in Reports.Java
Interactive sorting involves the ability to sort the data in the viewer. By clicking on the components with enabled sorting you can change the order of data output.

New Themes in Reports.Java
We added color schemes and MS Office 2013 UI themes in the HTML viewer.

WebSphere 5 & IBM Java SDK
One of the most flexible and productive environments for Java web applications is a WebSphere Application Server (WAS) from the IBM company. In the release of 2015.3, the reporting tool Reports.Java supports WebSphere 5 & IBM Java SDK.
By the links below you can see the full list of changes and download the latest version of the products
Stimulsoft Reports.Ultimate
Stimulsoft Reports.Net
Stimulsoft Reports.Silverlight
Stimulsoft Reports.Web
Stimulsoft Reports.Wpf
Stimulsoft Reports.WinRT
Stimulsoft Reports.JS
Stimulsoft Reports.Flex
Stimulsoft Reports.PHP
Stimulsoft Reports.Java
Stimulsoft Reports Server
In addition, we have prepared some Christmas Presents for you.