We continue to tell you about the Stimulsoft 2022.3 version and its new features. In the previous article, we told you about the Ribbon chart, and today you’ll learn about the new data adapter – GraphQL.

Creating a data source and using GraphQL queries solves several urgent problems like obtaining the necessary data from different sources and simplifying data processing and analysis.
GraphQL
Starting from the 2022.3 version, it has become easier to create a report or a dashboard based on the data received from web services using API. API data could be obtained using the REST protocol in the previous Stimulsoft versions. In the new release, we expanded the features of the report generator by adding the new data adapter to execute and process the queries received from web services using the GraphQL syntax. Facebook developed this language, and in 2015 it was publicly released for the first time. GraphQL is an excellent alternative in cases when you face the limits of traditional REST API interfaces.Creating a data source and using GraphQL queries solves several urgent problems like obtaining the necessary data from different sources and simplifying data processing and analysis.
GraphQL creation
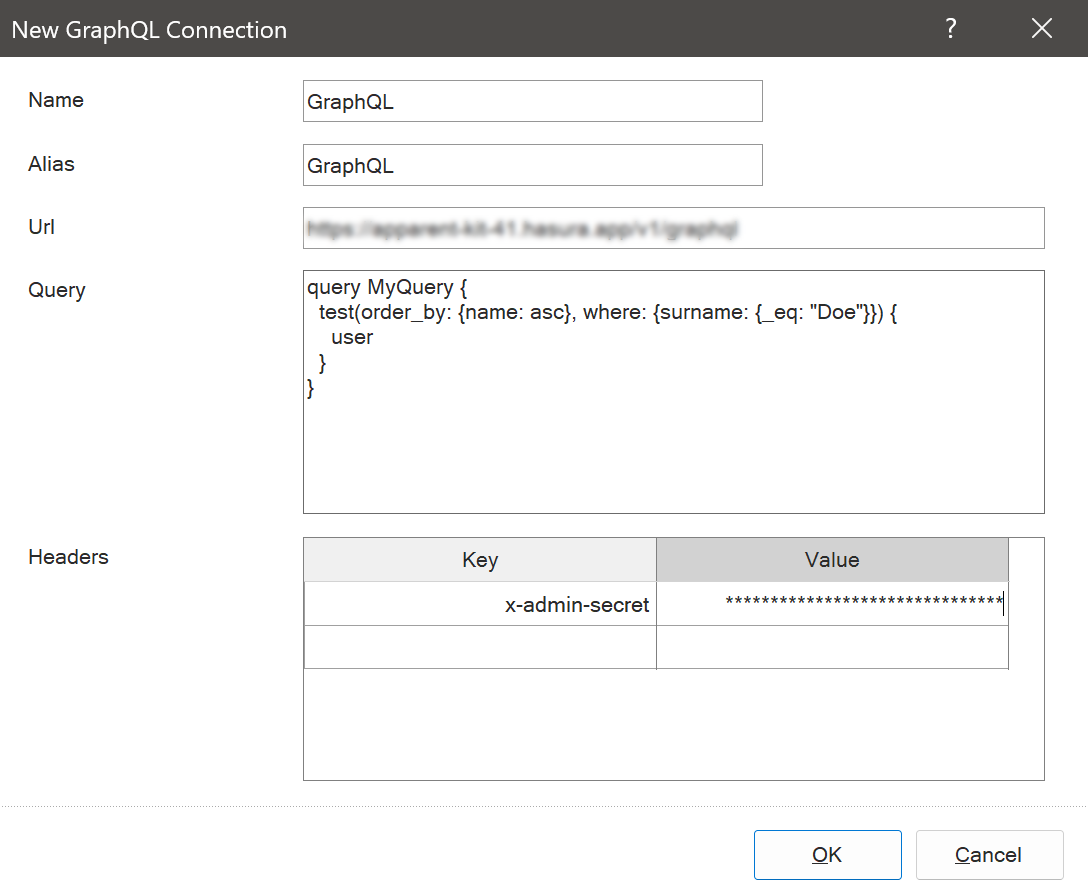
To create reports and dashboards based on the data received using GraphQL, you should first create a data source in the Dictionary. In general, the process of creating such a data source is similar to the process of creating other sources. The only difference is that you should specify specific connection parameters for GraphQL.So, you should go to the New Data Source window and select the GraphQL on the REST tab. Then, in the New GraphQL Connection dialog, you should specify:
- URL – the address of a data storage location;
- Query – the query body for data selection;
- Headers – depending on data storage, you can specify your access token, content-type, and others in the headers of a query.
After filling in the form of connection, you should click OK, and the report writer will send a query, get data and display them as a data source. Now, you can render a report or dashboard based on this source.
Change a select query
After creating and obtaining data, you may need to change a data selection query. In the case of using GraphQL data sources, there is an important feature. Since a data selection query is specified as a connection parameter and not in the Data Source of the Dictionary, then to change it, you should edit the connection. You should select the GraphQL connection and the Edit command in the dictionary. Change a query and save changes, having clicked OK in the connection editor.Using the GraphQL query language, you can select only the necessary data, which, in turn, will reduce the time it takes to obtain and process it and, accordingly, reduce the time it takes to render a report and display a dashboard.
On our YouTube channel, you can find a video about the work with the GraphQL data adapter, watch it, and don’t forget to subscribe to the channel to get the latest videos.
If you have questions, please contact our technical support specialists or join our community of tech experts and enthusiasts.