We continue the series of articles in which we talk about components of the report designer. The previous article was about the Online map element where we described its basic features and settings and demonstrated samples of dashboards with its use. This time we will tell you in detail about the Indicator element.
Indicator
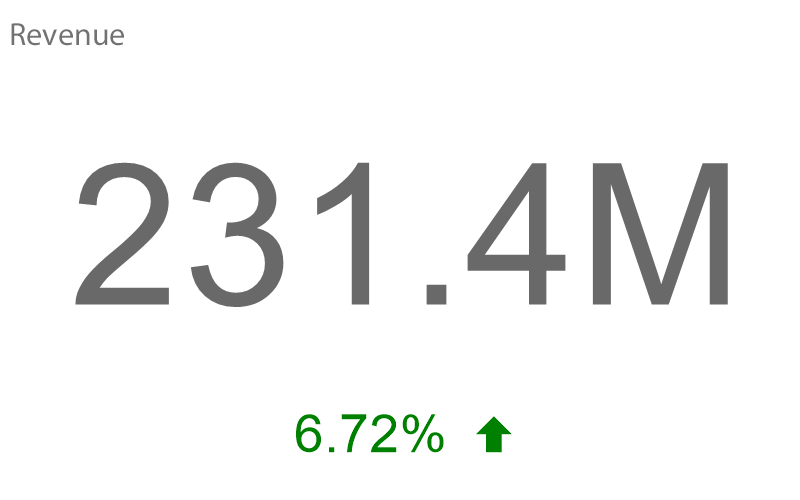
Indicator is a tool of data visualization that assists you to track changes of values, in particular the rate of growth of an aggregated value towards a target value. Using it, you can track, for example, the growth of a company’s profit and calculate its relative share.Let’s take a closer look at the features and settings of this element and learn about how to apply it in dashboards. Start with the fact that data is entered manually and added from data sources to an indicator in the element editor. In addition, you can edit an expression and select an icon for an indicator in the editor. There are quite a few icons, and they are all presented in various categories - Application, Transport, Gender, Payments, Currency, Brand, etc. Also, you can add your icon.
Important to know!
If an indicator has Series and Target specified, you can’t select an icon for the indicator in this case. However, if an indicator has a Value and Series specified, you can define a set of icons for indicators or ranges of values for each icon.
If an indicator has Series and Target specified, you can’t select an icon for the indicator in this case. However, if an indicator has a Value and Series specified, you can define a set of icons for indicators or ranges of values for each icon.
Let’s explore the Properties panel and settings. The panel contains such items of settings as Indicator, Appearance, Behavior and Design where you can select back color, font, corner radius, customize borders, margins, paddings and much more. We will focus on the indicator item and explore the Target Mode option.
This way, you can track the process of achieving your goal. Now let’s take a closer look at the practical use of this element in dashboards.
Target Mode
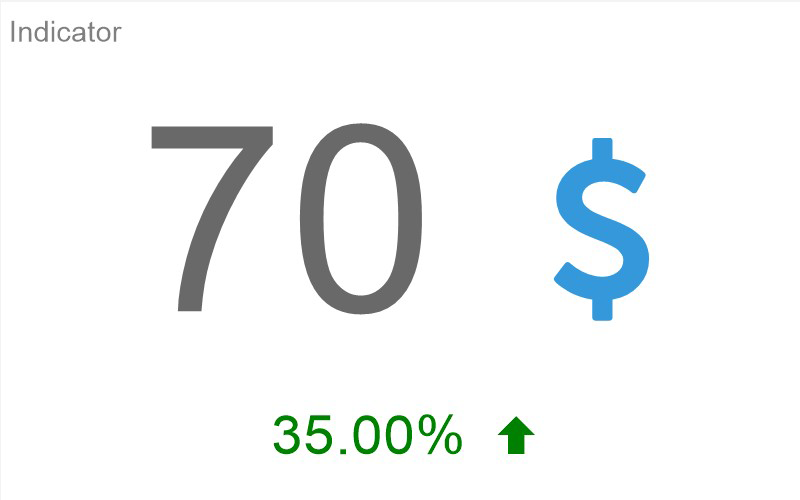
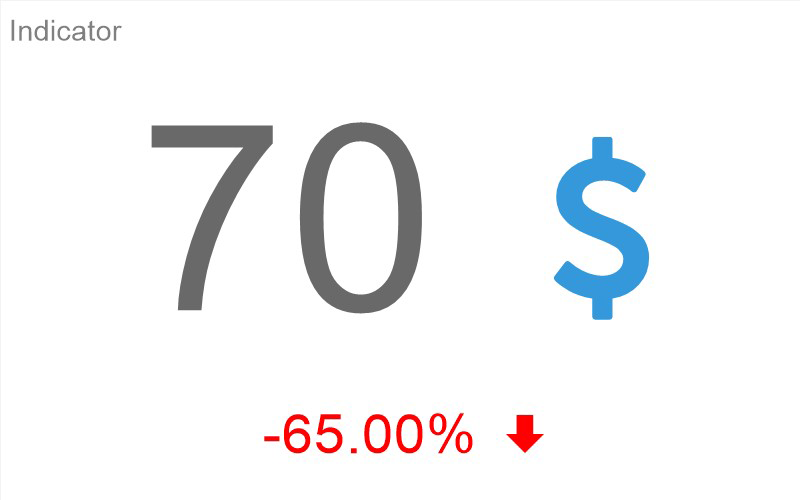
Target Mode will allow you to calculate a relative share of the Value in an indicator. Let's take a more illustrative example. Suppose you have planned to increase your company's profit to $200 million by the end of the year. However, at the moment, it is only 70 million. If you enter this data into an indicator and select the Percentage mode in the Target Mode option, the indicator will show the percentage of the Target that you have at the moment. In our case, it is 35%.If you select the Variation mode, the indicator will show the percentage of the Target that still needs to be achieved. Here it, respectively, will be equal to 65%.
This way, you can track the process of achieving your goal. Now let’s take a closer look at the practical use of this element in dashboards.
Samples of using the Indicator element in dashboards
In this dashboard, we used two indicators. In the first one, we displayed the population in Switzerland for 2019 and compared it with data for 2010. As a result, we also showed that the population grew by 8.57% during this time. This was done using the Target Mode option, where the Variation mode was selected. This way, we calculated a relative share of the Target – population in 2010. The same we did in the second indicator only for all regions of the country.The Indicator element can be used to display sales statistics, too.
In this case, we applied 4 indicators in which showed:
- sales statistics from 2013 to 2020;
- maximum growth;
- minimum growth;
- average growth.
In the first indicator, we also calculated the increase and decrease in sales as a percentage based on the highest and lowest sales using the Target Mode option with the Variation mode selected.
One more sample of using the Indicator element in dashboards is YouTube channel statistics by countries worldwide. Using the Indicator element we showed:
- Views;
- Shares;
- Playlist;
- Added and Removed User;
- Likes and Dislikes.
This way, having used the Indicator element, you’re able to display the statistics of your YouTube channel with all sorts of indicators. In the same way, you can show the statistics of your site, Telegram channel, Instagram account, etc.
You can read about how to create a dashboard with the Indicator element in the documentation.
Next time we will tell you about the Progress element and how to apply it in dashboards. If you have any questions regarding the article, pleaseThis email address is being protected from spambots. You need JavaScript enabled to view it. . We will be glad to help you.
Next time we will tell you about the Progress element and how to apply it in dashboards. If you have any questions regarding the article, please