


Stimulsoft Dashboards Cloud
The Business Intelligence platform contains all the necessary tools for preparing, analyzing, and visualizing data.You can easily combine all your data and display it in the form of interactive and stylized dashboards, share it with anyone in a way convenient for you.
Meet the Stimulsoft BI platform
The Stimulsoft BI platform is a unified environment that ties various elements of business – processes, personnel, roles, KPI (key performance indicators), authorization, and visualization. The presented solutions will help you quickly and easily realize the goals of Business Intelligence for your enterprise. Stimulsoft BI CloudYou may work with dashboards without the need to deploy the application on your servers. Collaborative work and versioning are available. The stable work of the Cloud is our responsibility.
 Stimulsoft EmbeddedA full cycle of working with dashboards in your applications. Many supported development platforms. No deductions for distributing the app with our dashboard tools. Runtime royalty-free.
 Stimulsoft BI DesignerUniversal application for working with data. The designer does not require programming skills and is ready to work on any computer and any platform. Desktop and online versions available.
 Stimulsoft BI ServerA complete client-server complex for Business Intelligence. You can manage users, assign access levels, process data, set up schedules, and send dashboards by email.
Data for analysis
Stimulsoft Dashboards Cloud supports many different ways to connect data for dashboards. A vast list of supported data servers - MS SQL, Oracle, Firebird, MySQL, PostgreSQL, and others. Support for all standard types of ADO.NET, OData protocol, multi-level business objects. Without problems, you can get data from XML, JSON, Excel, and other files.


Preliminary data preparation and conversion are available. You may use virtual data sources, and you may embed data directly into the template in the form of resources. This is just a shortlist of what the Stimulsoft BI platform can do with data.
Gauges, maps, charts and more
Stimulsoft Cloud has a well-selected set of elements that allows you to display informative data for quick and accurate decision making. All items complement each other, have many styles and properties for fine-tuning. Interactivity is available. A considerable number of localization languages make analytics understandable to everyone.-
53Custom
components -
30+Preset
styles -
42Chart
types -
95Regional
maps -
34Export
formats -
40+Interface
localization
One solution, unlimited possibilities
While developing Stimulsoft Dashboards Cloud, we used the latest technologies and tried to consider the suggestions of our clients. Thanks to this, you can easily and quickly analyze data on any device and any operating system. View analytical panels on the screen of your mobile phone or tablet. Support for Touch control, a separately configured mobile space, will help you analyze your data as efficiently as possible.
 Create and edit analytical panels on your computer. A universal designer is great for desktop Windows, and macOS systems support working with templates in the cloud.
 Our products are perfect for working on devices with different resolutions and screen sizes. HiDPI support, low memory, resource, and other optimizations make it possible to use your time efficiently.
 No way to install additional software on a computer? Need to work from different places? Use our cloud solution to work in the Web browser. It has the same functionality as desktop applications.
Interactive graphics
For better understanding the dynamics and better visualizations of your data, you may use various charts and graphs. You can use interactive diagrams to display sales statistics for a certain period, expenses by the department of an enterprise, exchange rates, etc.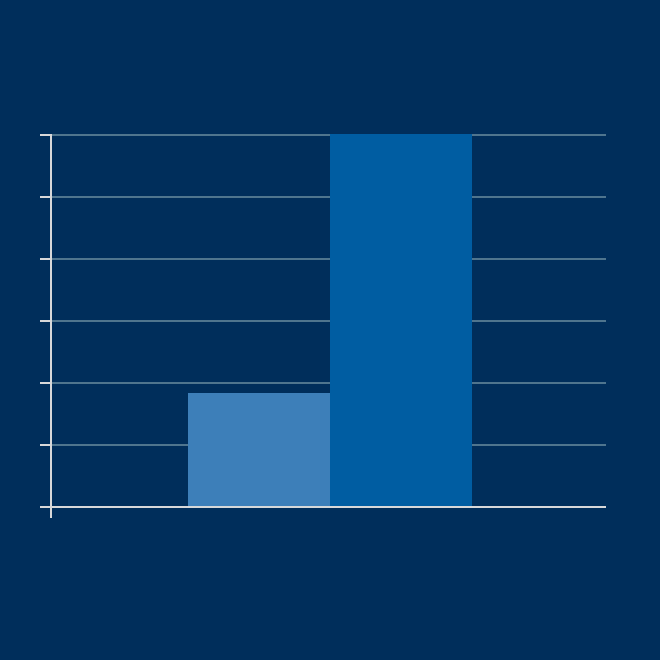
Interactive maps
Built-in and online maps allow you to display data around the world instantly. For example, you can view sales of any product for a region or country. A powerful editor allows you not only to display complex data across the locations but also to add a custom map.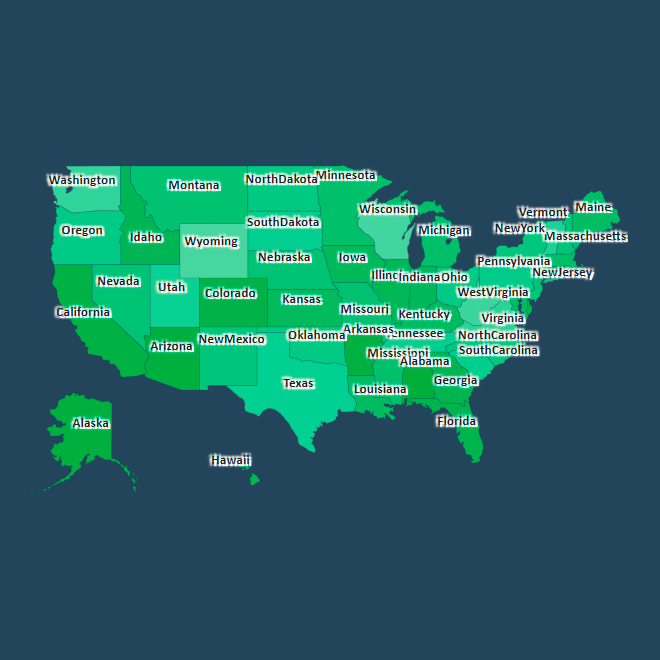
Interactive Dashboards
Stimulsoft Dashboards Cloud lets you customize the unique interaction of animated charts, gauges, tables, and infographics to suit your needs. Special data filtering elements further expand the robust functionality of dashboards. See how easy and understandable it is to manage dashboard elements and dive inside into the analysis of complex data arrays.Save the result in the required format
You can save the analyzed data as a file, send it by e-mail, or share it on social networks. More than 30 formats are available – Excel, XML, JSON, PDF, and others. We support the export of the entire dashboard or elements separately. For example, a table with the specified filters and sorting can be saved in a data file and then used in other documents.


Teamwork
Use Stimulsoft Dashboards Cloud in a team, invite new members, and work together. Collaborate and share dashboards with colleagues with one click. Allow access to the workspace in the cloud and assign roles to new team members. Key performance indicators for your business will be available from anywhere in the world, from any device.Share your Dashboards
You can easily provide access to the finished dashboard through a unique hyperlink. Share the link with your business partners, or publish it on the website page. There is no need to deploy and configure custom components. The dashboard will immediately be available anywhere in the world, on any device.

