


Stimulsoft Dashboards.WEB
Creating dashboards in Web apps
Stimulsoft Dashboards.WEB is a tool for creating, editing, exporting, and viewing dashboards in web applications developed on the ASP.NET, .NET Core, ASP.NET MVC, Angular and Blazor platforms. The product includes a variety of data analysis and visualization elements, is easily integrated into any web project, allows you to work with data from multiple sources, and has a flexible licensing model.Types of Dashboards
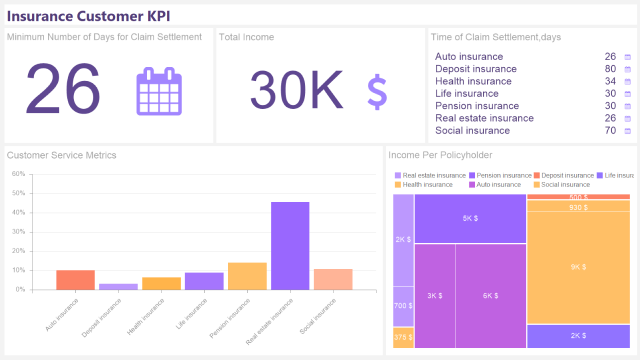
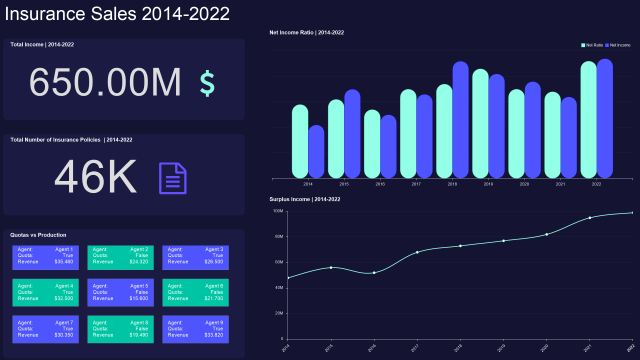
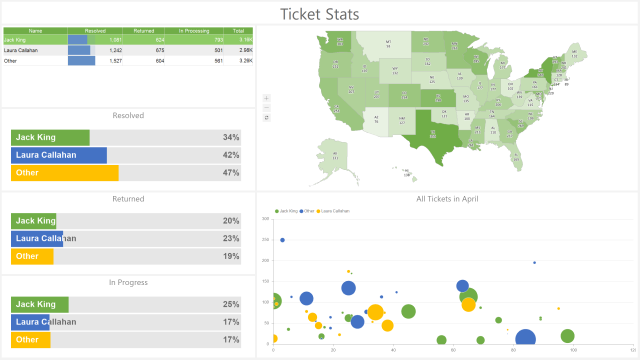
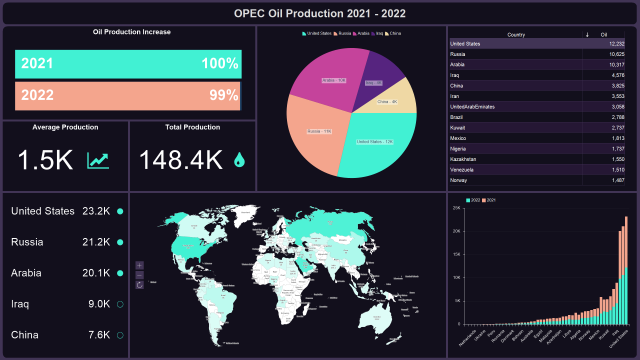
Stimulsoft Dashboards.WEB allows you to create a variety of analytical panels, including KPI and HR dashboards, sales and insurance dashboards, statistical and marketing panels. You can start quickly by exploring a range of professional examples available in the Demo cloud service and within the designer.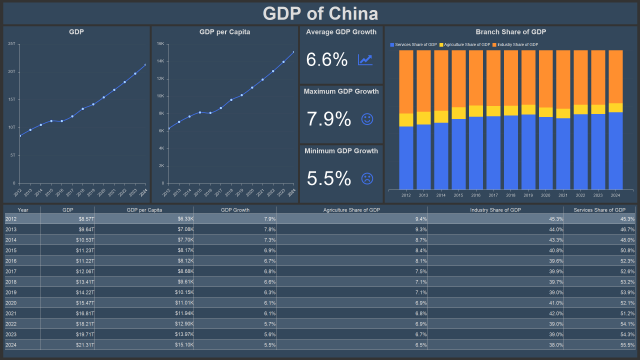
Creating dashboards
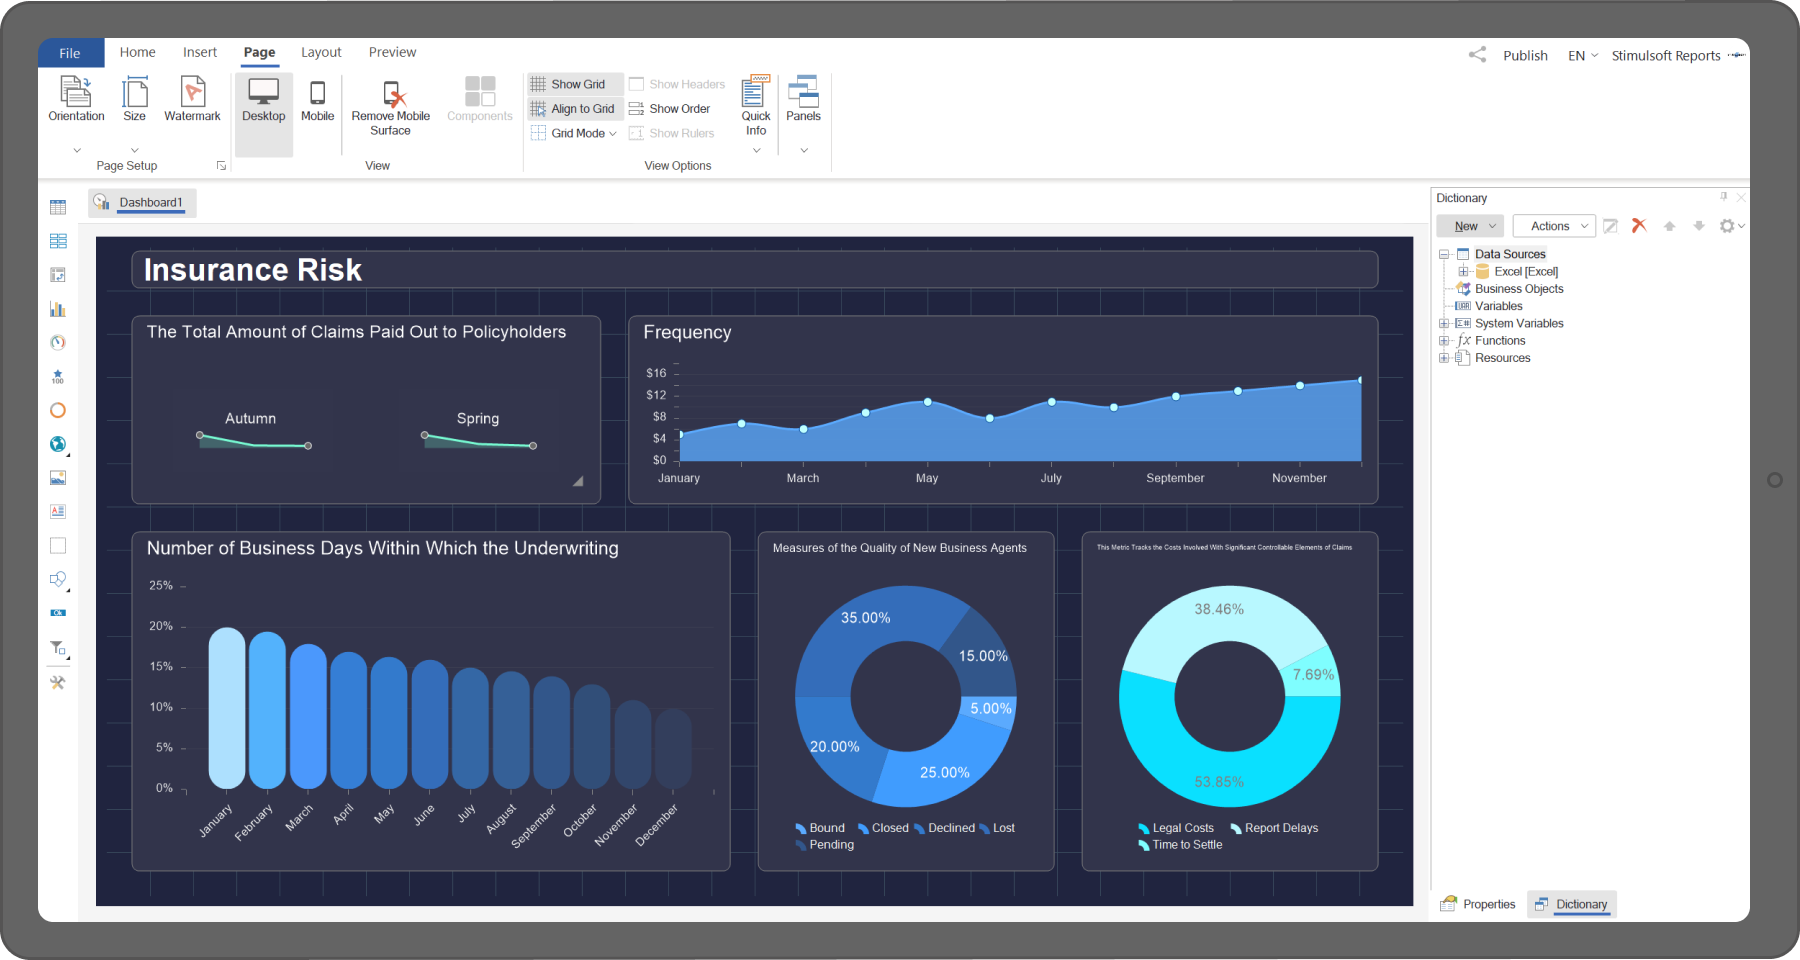
Dashboard designer is a key tool in the product where data is processed directly. You can connect data from a vast number of sources, including SQL (MS SQL, MySQL, Firebird, MS Access, etc.), MongoDB, Azure, and Google, file sources (JSON, Excel, XML, etc.), and many others. The designer interface is familiar to many users, with a Ribbon-style layout, and includes options for grouping and sorting data, as well as a variety of elements that can be used to turn data into informative and attractive dashboards.In addition, the Dashboard Designer component is licensed without the need to pay royalties or license fees for every customer of your applications. Their use and deployment with our embedded tool do not require additional charges.
Dashboard visualization
The most important stage of working with data is its visualization. For this task, a special tool, a dashboard viewer, is used in the Stimulsoft Dashboards.WEB product to view ready dashboards in web applications. Any browser with HTML5 support is required for its operation. The dashboard viewer is fully customizable, fast, and convenient to use, supports interactive elements, the full-screen mode for viewing the entire dashboard and individual elements, and converting the analytical panel to PDF, Excel, PNG, and other formats. To fully integrate into projects, we offer a variety of theme options and customization options for the appearance and functionality of the application.

Mobile mode
The number of people who visualize and analyze data using phones and tablets is constantly growing. We always keep up with the times, and that is why the following is available in our products:- dashboards viewable on phones, tablets, and other mobile devices;
- a mobile-optimized design and view mode;
- automatic change of the viewer interface theme depending on the selected dashboard style;
- selective display of dashboard elements only in mobile mode, with customization of size and placement;
- the ability to set a device screen width threshold for switching to mobile mode.
Integration
Our data analytics and visualization product is designed for integration into web projects built using the ASP.NET, ASP.NET MVC, .NET Core, Angular and Blazor platforms. You can control all stages of dashboard work, from data loading and connection to viewing and printing of the final document. In addition to a wide range of visual components, any actions can be performed using server-side code. .NET Core
 ASP.NET
 ASP.NET MVC
Diverse selection of widgets
There are a lot of elements for creating and editing dashboards, from shapes to buttons, that execute various scripts. Check out the variety of Stimulsoft Dashboards.WEB features: Table
Table
A set of data elements that is organized using a model of vertical columns and horizontal rows.
 Indicator
The element displays the difference in values between the input data.
 Chart
Chart
A graphical element of data analysis, using which the data can be processed and the result is displayed as graphs.
 Progress
The element displays the ratio of the input data. It can be presented in different modes – a pie, donut, bars.
 Pivot Table
A dashboard element designed for processing, grouping, and summarizing data by rows and columns, as well as presenting structured data in tabular form.
 Online Map
An element for displaying geographic markers on the online map.
 Text
Text
This element is a basic object to output data as a text.
 Gauge
Gauge
The element allows you to display a value within a predefined range. It can have different graphical representation.
 Region Map
This element is used to display data that is geographically targeted.
 Shape
Shape
An element for displaying various shapes on the dashboard, including primitives, arrows, lines, flowcharts.
 Cards
Cards
The component for displaying grouped data as cards.
 Button
The special element allows you to execute various scripts by click or depending on a condition.
 Filter
A group of elements designed to filter data in related dashboard components.
 Image
Image
An element is designed to add and display photos, logos, pictures, etc. on the dashboard.
 Panel
Panel
An element can be used as a container for other dashboard elements.
Functionality of Stimulsoft solution
Our data analytics and visualization system involves flexible settings and a wide range of possibilities for representing data on dashboards. In addition to a large number of data sources, visualization elements, and export formats, our product also includes:The ability to use dashboard variables as parameters with the option to select and enter custom values for filtering data elements in the dashboard or in a query to the data repository.
The product allows you to use expressions in the fields of dashboard elements with various mathematical operations for data column values, variables, and constants.
This feature includes a wide range of functionality - from displaying drill-down data for a dashboard element to showing another dashboard or report with the ability to pass a parameter to it.
When viewing a dashboard, you can filter data by a specific value, configure sorting, and group different dashboard elements.
Our platform allows the use of functions, including Sum, Count, Min, Max, First, and Last, on the data fields. The report dictionary contains a list of functions for the field expressions of items.
Highlighting of dashboard element values depending on a specified condition. This allows you to define text formatting, background, borders, add and modify icons.
Data for dashboards
One of the key advantages of our product is the diversity of data you can use for creating dashboards in your application. We offer a large list of supported data servers – MS SQL, Firebird, MySQL, PostgreSQL, etc. Also, you can get data from XML, JSON, Excel, and other file sources.Licensing
Stimulsoft Dashboards.WEB tool for data analytics is licensed the same way as other products for creating dashboards. We offer 4 types of licensing according to the number of developers who will directly work with the product. Single
 Team
Team Enterprise
 WorldWide
License terms include the possibility of a free trial period of 30 days, including the Subscription Program, and do not require additional fees to use the product.

Source Code
Source code is available for all Stimulsoft products, including Stimulsoft Dashboards.WEB. Source code of a product allows you to both fully customize your application and add new functional features to it. We use unified builds for reports and dashboards, and the source code is supplied for the files specified in the license agreement in the Redistributributables section.
AI functionality in the report designer
The report designer includes AI functionality to assist with various stages of report creation. The AI assistant is integrated into many elements, such as events, variables, conditions, and more. It can verify and correct connection strings for SQL data sources, check event script code, convert scripts written in Blockly to code, validate expressions, and much more.
Make the right choice
By purchasing our product, you receive a flexible and fully customizable set of tools for working with dashboards on various devices and operating systems. In addition, you receive technical support and numerous ready-to-use solutions for business analytics. Furthermore, there is an option to purchase a license with source code of the product.
Stimulsoft Ultimate
Stimulsoft Dashboards.WEB is part of Stimulsoft Ultimate, a comprehensive All-in-One set of products designed for working with data on all modern platforms such as .NET, ASP.NET, JavaScript, Java, PHP, Blazor, Angular, WPF, WinForms, Avalonia UI, Python, and others. With our components, you can create, print, export complex reports, analyze data using clear and colorful dashboards, and collect data from users through interactive forms.What's next?
We have prepared hundreds of reports and dashboards templates grouped by spheres of use. You can immediately use them by connecting your data or change according to your requirements. Our lessons and technical documentation will help make your work effective! Moreover, you can request the training courses from our technical specialists, subscribe to our YouTube channel to always get new videos, and receive all your answers in our online documentation.
Training courses
Are you faced with difficulties when creating reports and dashboards? This is not a problem!
Video lessons
We have prepared many video materials for the designing reports and dashboards. All tutorials are grouped by specific topics and regularly updated and supplemented.
Documentation
Our online user guides describe both the general functionality of the product and provide advice and suggestions for the report design and hints of setting components for reporting.