


Stimulsoft Reports.WPF
Report generator for WPF
Stimulsoft Reports.WPF is a powerful and flexible report generator for the Windows Presentation Foundation platform. The product includes wide features for creating, viewing, printing, exporting reports. The product contains a powerful engine for report rendering, a user-friendly designer with a familiar interface and a rapid report viewer for observing. Our product is based on many years of experience in creating products for data visualization and analysis.Report Viewer
The viewer is a special component for report viewing. A report is viewed more often than created or edited, so the process is more important. On this basis, the report viewer should be fast, convenient, and fully customizable. Our component supports the work with parameters, multi-level drill-down, interactive reports, viewing and saving resources, and much more. For full integration into projects, we offer many design themes and options to customize the appearance and functionality of the application.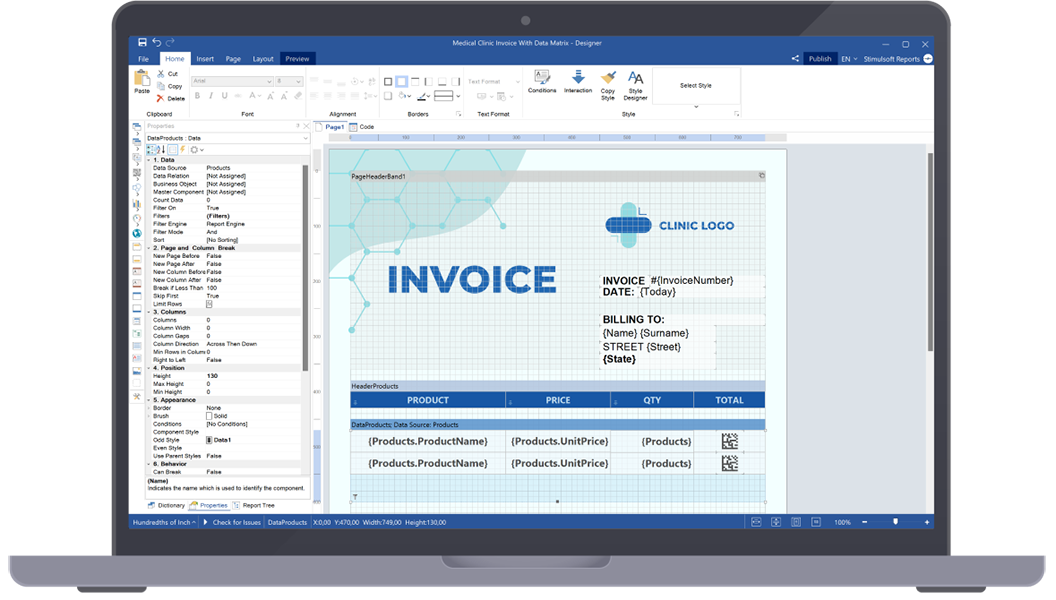
Report Designer
The most important part of Stimulsoft Reports.WPF is the report designer – a component for integration and use in WPF applications. It is very simple to use – you need only several strings of code, and your clients can start creating new reports and working with already existing ones. Besides, the component supports localization of 30+ languages and has a familiar Ribbon UI and many report wizards.Our run-time report designer component is royalty free free for end-users.
- A component for integration to the projects that use the WPF platform. It only takes a few lines of code to get started.
Show code
// Code example var report = new StiReport(); report.DesignWithWpf(); - An standalone report designer for work with reports on a developer’s computer that is supported for Windows, macOS and Linux.

AI functionality in the report designer
The report designer includes AI functionality to assist with various stages of report creation. The Stimul AI assistant is integrated into many elements, such as events, variables, conditions, and more. It can verify and correct connection strings for SQL data sources, check event script code, convert scripts written in Blockly to code, validate expressions, and much more.Learn more about the Stimul AI assistant here.
Report design step-by-step
Our product provides a full cycle of working with reports - from connecting data to exporting a rendered document to variety of formats.


1
Connect data from various data sources by dragging them into the designer or adding them from the code.
2
Select the necessary components for displaying data - tables, charts, maps, text, barcodes, and more.
3
Customize the appearance of the report using a collection of styles, component editors. Add images and watermarks.


4
Present the data in the required form using grouping and sorting, variables, and mathematical formulas.
5
Go to preview to see the rendered report. Make the necessary changes, and prepare a report for printing or exporting.
6
Share the finished document on social networks or send it by email, export it to the required format, or publish it directly to the project.
1
Connect data from various data sources by dragging them into the designer or adding them from the code.
2
Select the necessary components for displaying data - tables, charts, maps, text, barcodes, and more.
3
Customize the appearance of the report using a collection of styles, component editors. Add images and watermarks.
4
Present the data in the required form using grouping and sorting, variables, and mathematical formulas.
5
Go to preview to see the rendered report. Make the necessary changes, and prepare a report for printing or exporting.
6
Share the finished document on social networks or send it by email, export it to the required format, or publish it directly to the project.
Data for reports
Our reporting tool supports many ways to connect data to a report using both the report designer functionality and code. We offer a vast list of supported data servers – MS SQL, Firebird, MySQL, PostgreSQL, etc. We support all standard types of OData protocol. You can get data from XML, JSON, Excel, and other files.Integration
The Stimulsoft Reports.WPF reporting tool is intended for integration into WPF projects. Using our components, you can create, edit, print, view reports in your application. Besides, any actions on a report can be performed using C#/VB.NET code, and for tighter integration, many properties and events are provided for both components and the report generator. Also, a special component for report viewing in the WPF application is available in the product. Windows Presentation Foundation
Compatibility
Stimulsoft Reports.WPF is the integral part of the Stimulsoft platform. Reports created in our other products will work in Stimulsoft Reports.WPF and vice versa. You can create reports on a computer and continue editing them in the cloud with the help of the online designer. We have tried to ensure the compatibility of the reports, to the extent possible for a particular technology. Moreover, we offer tools for importing reports from files of other popular reporting systems into our universal internal format.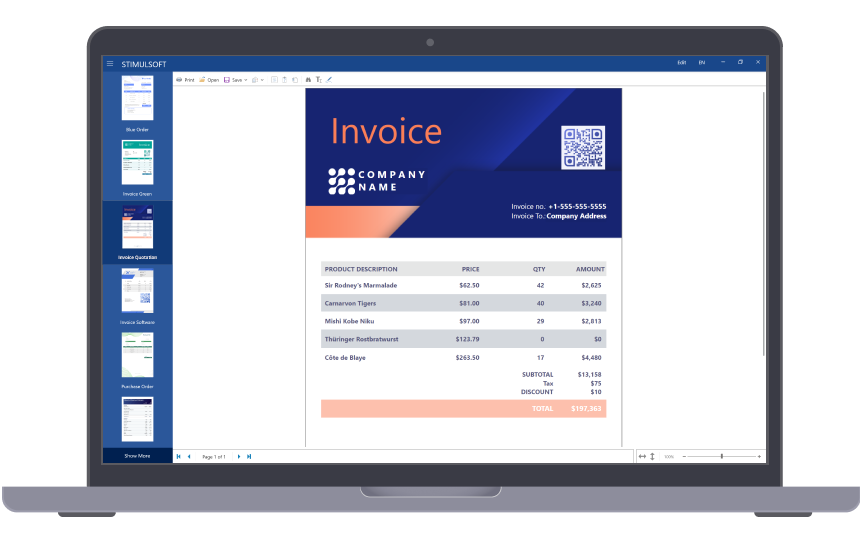
Stimulsoft WPF Demo
Stimulsoft Demo.WPF is a demo application for exploring the functionality and benefits of a reporting tool and dashboard panels. It contains lots of specific reports and dashboards designed by us. We grouped them by categories and features.
Stimulsoft Ultimate
Stimulsoft Reports.WPF is part of Stimulsoft Ultimate, a comprehensive All-in-One set of products designed for working with data on all modern platforms such as .NET, ASP.NET, JavaScript, Java, PHP, Blazor, Angular, WPF, WinForms, Avalonia UI, Python, and others. With our components, you can create, print, export complex reports, analyze data using clear and colorful dashboards, and collect data from users through interactive forms.What's next?
We have prepared hundreds of reports and dashboards templates grouped by spheres of use. You can immediately use them by connecting your data or change according to your requirements. Our lessons and technical documentation will help make your work effective! Moreover, you can request the training courses from our technical specialists, subscribe to our YouTube channel to always get new videos, and receive all your answers in our online documentation.
Training courses
Are you faced with difficulties when creating reports and dashboards? This is not a problem!
Video lessons
We have prepared many video materials for the designing reports and dashboards. All tutorials are grouped by specific topics and regularly updated and supplemented.
Documentation
Our online user guides describe both the general functionality of the product and provide advice and suggestions for the report design and hints of setting components for reporting.