Dear friends, we continue our series of articles on optimizing reports. Last time we talked about the basics of optimizing directly when creating reports. As for advice for advanced, experienced users of our software products, today we offer a few suggestions to help you avoid unnecessary costs.
As in the previous article, we divided the optimization into two main categories: increasing the speed of rendering reports and reducing memory used for generating reports . So, let’s get started:
Avoid using the Sub-Report component
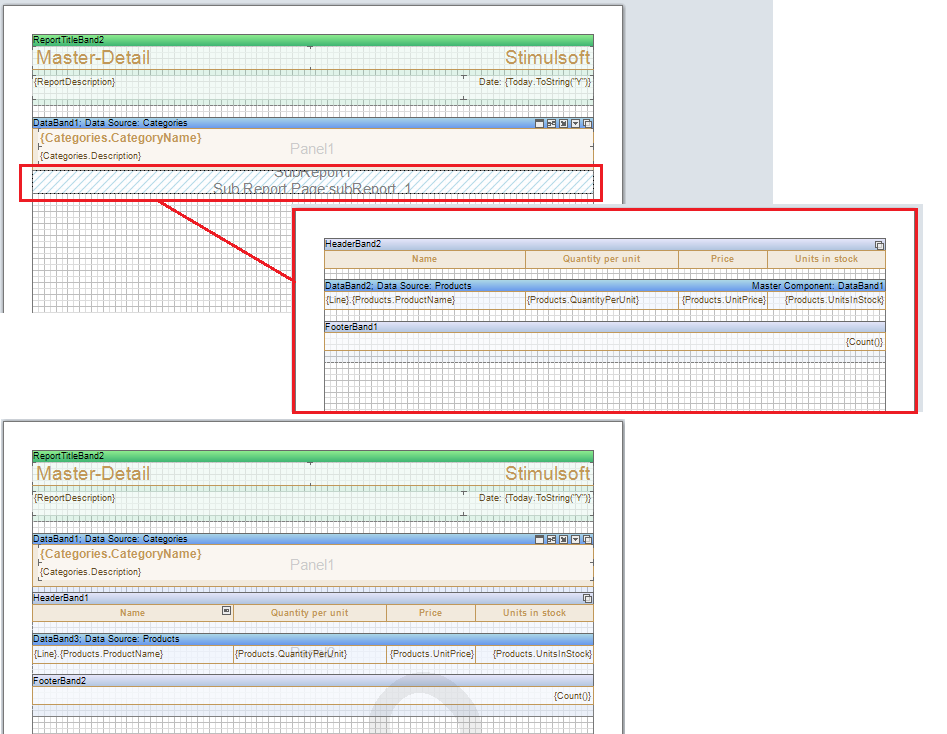
To speed up report rendering, we recommend you stop using sub-reports in favor of using the DataBand component. The main reason for this recommendation is that, when rendering the Sub-Report, one page of infinite height is created. In the end of rendering this page is broken. This leads to numerous subsequent checks. When using the DataBand component, contents are fully laid out in the main report. In addition, the engine of our reporting tool is highly optimized to work with the DataBand component.
Working with the Report Checker utility
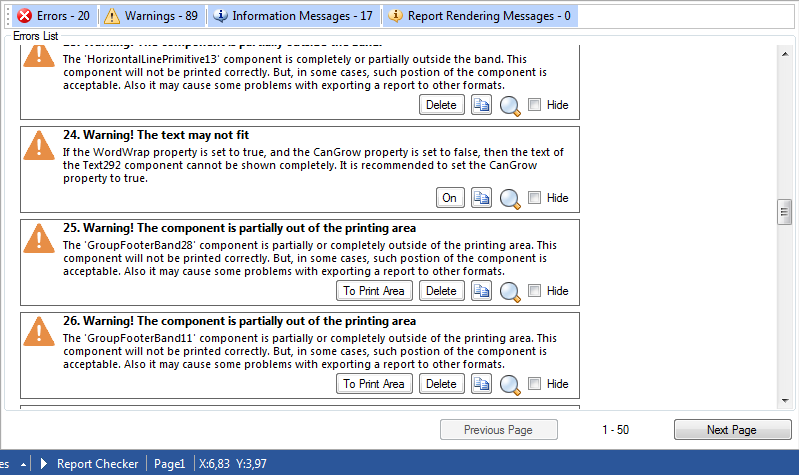
In Stimulsoft Reports, the Report Checker is used for checking the report on errors. This component analyzes the report, resulting in information and error messages or alerts found in reports. If any errors occur while rendering a report, then the Checker generates messages and offers solutions for some of them. For example remove a component, move it to the print area, enable or disable properties, and so on. This will significantly speed up the process of rendering reports.
Interpretation mode
In the interpretation mode the compilation does not occur. So time and memory is not used. It is very important, especially when a report has a great number of components. However, it should be noted that this mode is relatively new, so you may have some issues with this. For example, incorrect handling of complex expressions. Also scripts, used in the report events, are not working in this mode.
Connecting assemblies
Another method of increasing the speed of report building and reducing memory usage is a compilation of the report as an assembly - .dll file. The main advantage of this method lies in the fact that the compilation occurs only once. The next time already compiled report is loaded. There is one issue with this. When updating to the latest product version, you have to re-compile a report from a template (.mrt file) into the assembly. Otherwise some errors may occur.
Working with the Table component
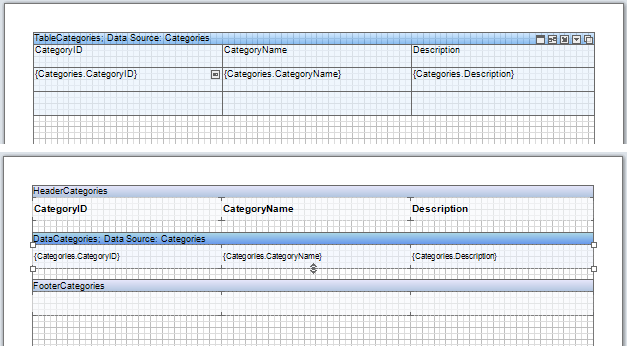
Table is a compound component. If you render complex reports, it is better to replace it with a band, because the Table consists of a set of items and rebuilding of each item involves a number of checks by all the other items and, if your report has a complex structure, some issues may occur with wrapping and breaking table cells. This component is good to create reports fast, but it slows the rendering process. It can be used in creating simple lists reports and reports without a very complex structure. In other cases it is desirable to replace it with a band.

As in the previous article, we divided the optimization into two main categories: increasing the speed of rendering reports and reducing memory used for generating reports . So, let’s get started:
Avoid using the Sub-Report component
To speed up report rendering, we recommend you stop using sub-reports in favor of using the DataBand component. The main reason for this recommendation is that, when rendering the Sub-Report, one page of infinite height is created. In the end of rendering this page is broken. This leads to numerous subsequent checks. When using the DataBand component, contents are fully laid out in the main report. In addition, the engine of our reporting tool is highly optimized to work with the DataBand component.

Working with the Report Checker utility
In Stimulsoft Reports, the Report Checker is used for checking the report on errors. This component analyzes the report, resulting in information and error messages or alerts found in reports. If any errors occur while rendering a report, then the Checker generates messages and offers solutions for some of them. For example remove a component, move it to the print area, enable or disable properties, and so on. This will significantly speed up the process of rendering reports.

Interpretation mode
In the interpretation mode the compilation does not occur. So time and memory is not used. It is very important, especially when a report has a great number of components. However, it should be noted that this mode is relatively new, so you may have some issues with this. For example, incorrect handling of complex expressions. Also scripts, used in the report events, are not working in this mode.
Connecting assemblies
Another method of increasing the speed of report building and reducing memory usage is a compilation of the report as an assembly - .dll file. The main advantage of this method lies in the fact that the compilation occurs only once. The next time already compiled report is loaded. There is one issue with this. When updating to the latest product version, you have to re-compile a report from a template (.mrt file) into the assembly. Otherwise some errors may occur.
Working with the Table component
Table is a compound component. If you render complex reports, it is better to replace it with a band, because the Table consists of a set of items and rebuilding of each item involves a number of checks by all the other items and, if your report has a complex structure, some issues may occur with wrapping and breaking table cells. This component is good to create reports fast, but it slows the rendering process. It can be used in creating simple lists reports and reports without a very complex structure. In other cases it is desirable to replace it with a band.
