We continue the series of articles about visualization and data analytics. In the previous articles, we wrote about downloading and installing the report designer and how to connect data in a report. Also, you get an idea of what a dashboard is and what it is intended for. We gave you some basic information about the Table element and learned how to create a dashboard with it. Today, we’re going to tell you about the Chart element.
Each of them has its visual data representation. A chart is a customizable element that can be edited and modified using the Chart editor and Properties panel. First, we will tell you about the chart editor.
So, we considered some features of the chart editor. Now let’s have a look at other elements that are placed and customized in the properties panel.
The chart legend is the list of countries at the top left.Available for the legend:
Chart
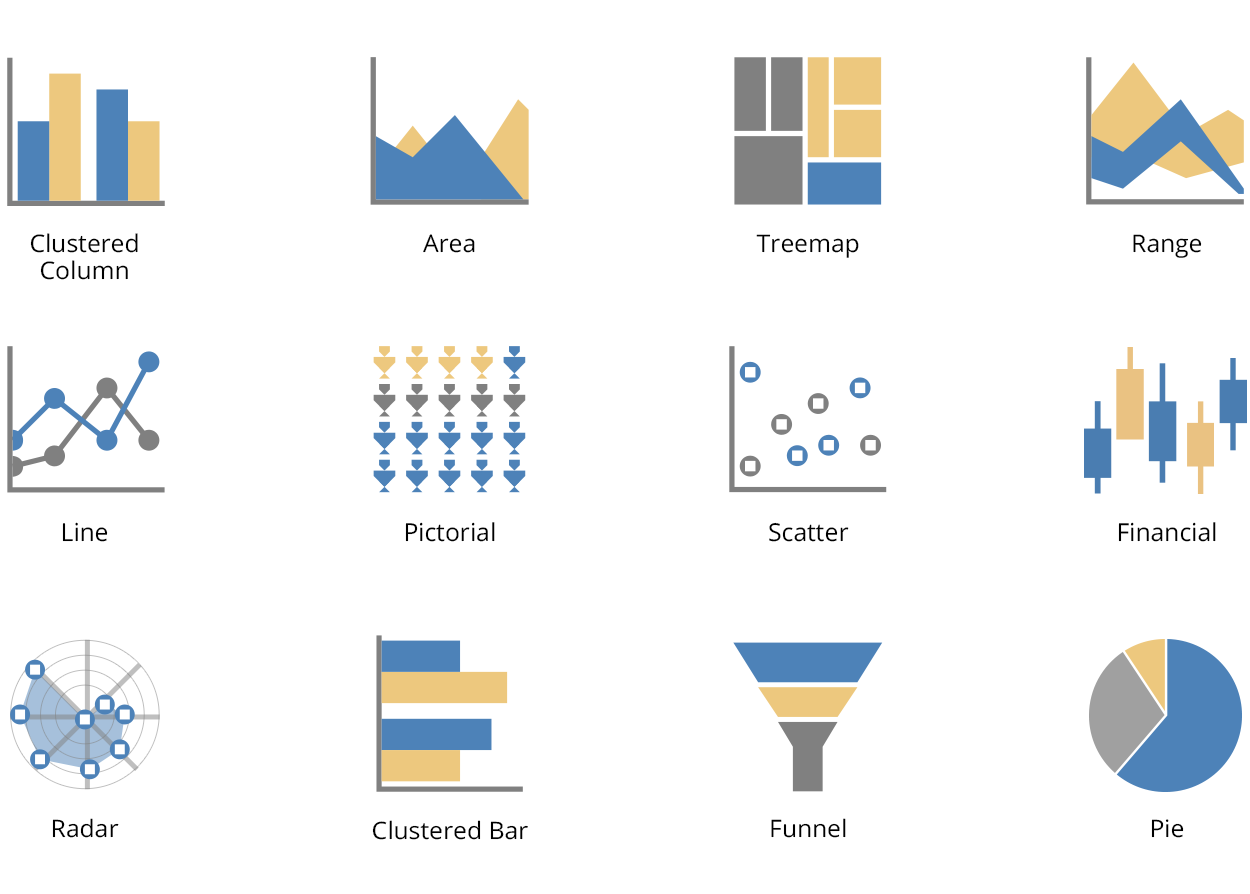
The chart is a graphical element used for visualization and data analysis. Using it, you can display data with linear segments and various geometric shapes that allow you to evaluate the correlation of several values quickly. There are many chart types in Stimulsoft report designer:Each of them has its visual data representation. A chart is a customizable element that can be edited and modified using the Chart editor and Properties panel. First, we will tell you about the chart editor.
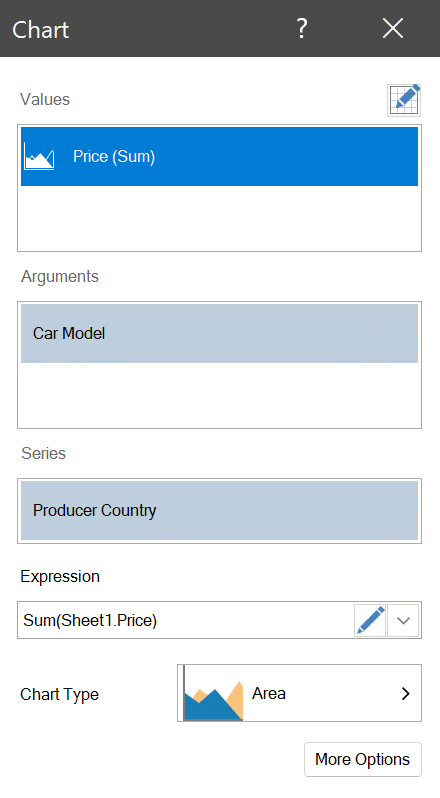
Chart editor
The Chart editor is used to set up and customize graphs. Using it you can:
Basic fields for placing data columns in a chart – Values, Arguments, and Series.
However, other fields may be in the editor, depending on the chart. For example, you should specify data in the following fields for financial charts - high and low, open and close values. For Bubbles – x, y, and weight values.
Also, the editor contains an option that allows you to display graphical chart elements as icons. You should know that the editor has a wide range of icons grouped into various categories - transport, payments, brand, medical, etc.
- select chart type;
- select data columns (data can be specified both from data sources and manually);
- change an expression of a selected data field.
Basic fields for placing data columns in a chart – Values, Arguments, and Series.
However, other fields may be in the editor, depending on the chart. For example, you should specify data in the following fields for financial charts - high and low, open and close values. For Bubbles – x, y, and weight values.
Also, the editor contains an option that allows you to display graphical chart elements as icons. You should know that the editor has a wide range of icons grouped into various categories - transport, payments, brand, medical, etc.
So, we considered some features of the chart editor. Now let’s have a look at other elements that are placed and customized in the properties panel.
Chart legend
The Chart legend is a list of data elements names displayed in a chart with a corresponding color for each. This element is enabled automatically after specifying data columns in the Series field.The chart legend is the list of countries at the top left.Available for the legend:
- alignment horizontally and vertically;
- customization of data elements headers;
- enter and edit of text;
- font and color selection;
- arrangement of columns;
- changing direction;
- disable.
Trend line
The Trend line is an element of technical analysis to identify trends in prices, losses, and profits of a company, the company, the number of sales, etc. In a chart, you can customize a type of trend line, its color, style, and width.Constant line
Constant in Latin means permanent, unchanging. In a chart, the above element is a constant, unchanging line, using which you can track, for example, the dynamics of your company's sales by month, and also see in which month your profits fell and in which they increased.You can read about how to create a dashboard with the Chart element in our documentation.
Next time you’ll learn about features of the Gauge element. If you have any questions about the chart or creating a dashboard with it, please contact us. We’re glad to assist you.