We are starting a series of articles dedicated to data analytic and visualization. Namely, it is the main tool – report designer. In the series, you will learn everything about working with the application and creating reports and dashboards in general. In today’s world, it isn’t easy to imagine any sphere of human activity without reporting services. Starting from large transnational corporations to small businesses, all need reports.
Recommendation.
To work with the Stimulsoft report generator correctly, we urge you to update to the latest version of our products constantly.
- Financial
- Analytical
- Accounting
Report designer
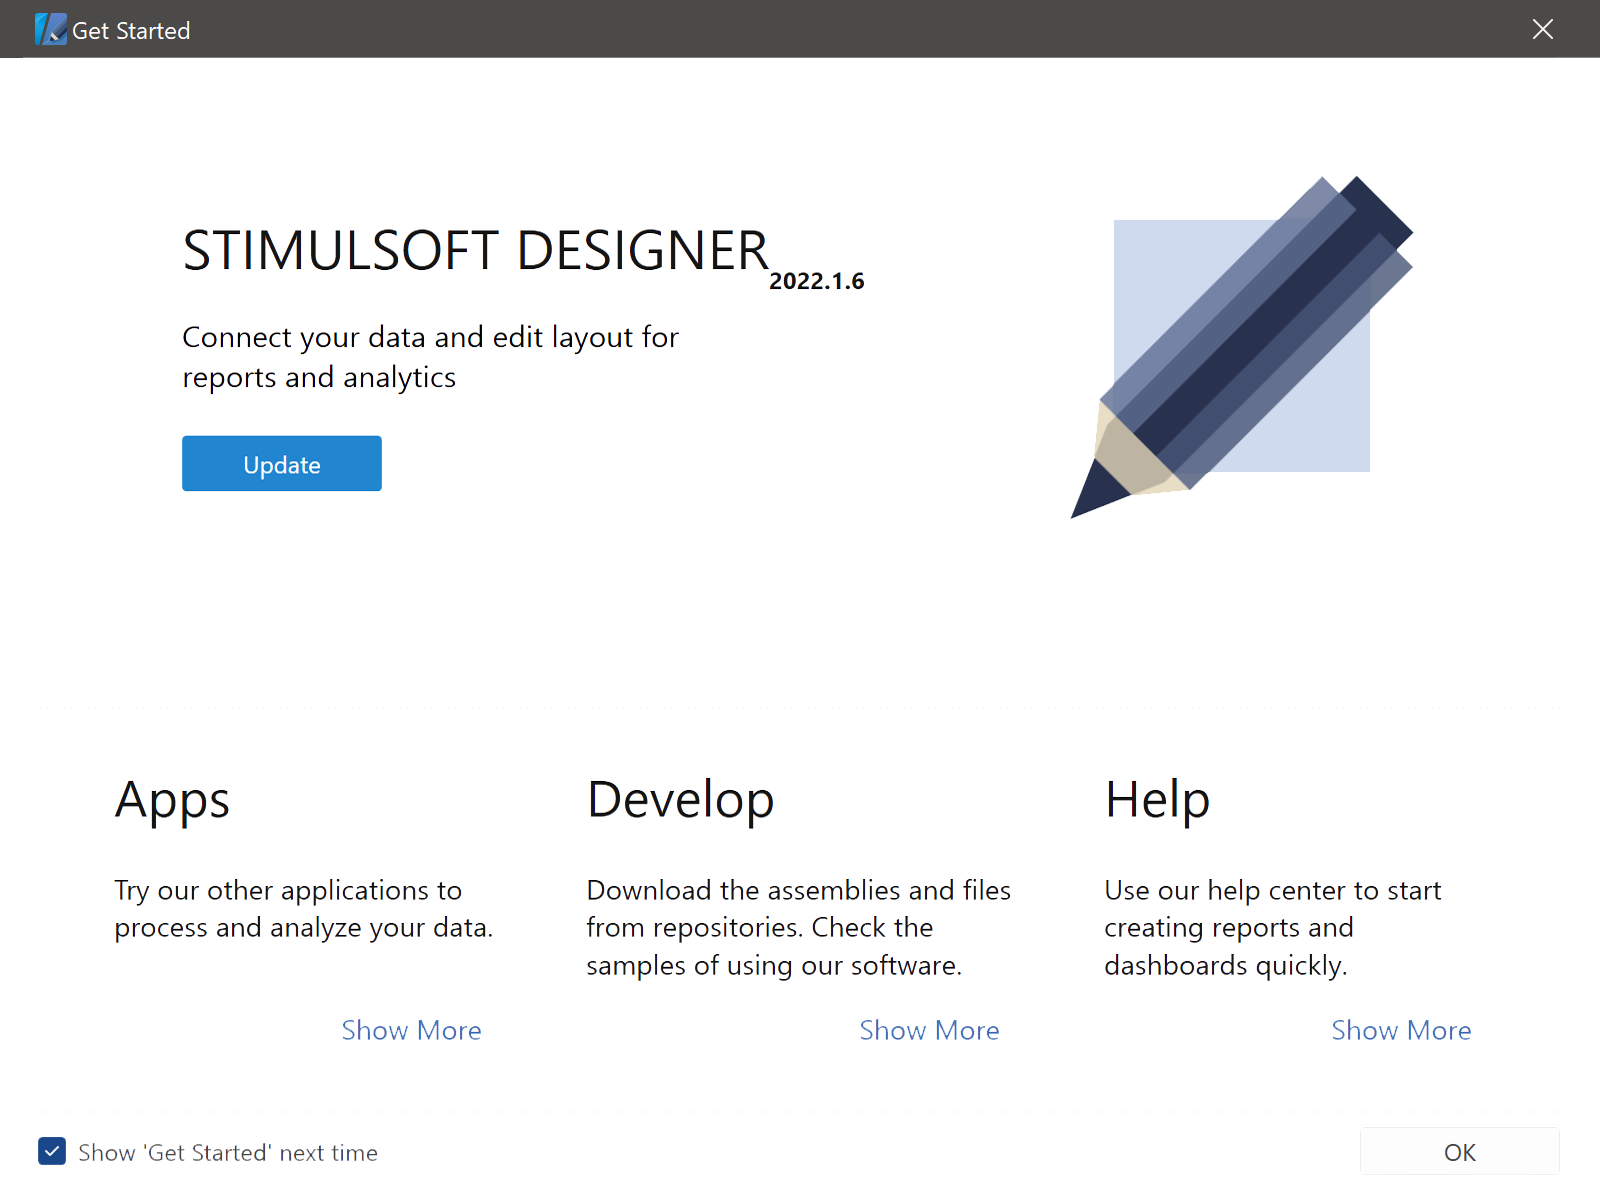
There are a lot of services and reporting tools, but their main element – report designer. This application is used for creating, designing and editing reports and dashboards. Apart from these features, Stimulsoft report designer provides access to download of developer packages for various platforms, publishing a report to a project, work with cloud and much more. However, sometimes new users face problems with the first run of the application and further work with it. Let's clear things up.Firstly, download
In fact, everything is much easier than it seems. First of all, you should download the application. You can do this on our website, on the main tab, or on the Downloads tab. Anyway, you have to go to the download page, in which you click the Download button, and the file will be downloaded to your storage or any path you specify. If you are using our tool already, then when a new one appears, an update dialog will pop up, and you agree with it, having clicked the Update button. After that, the setup file will be downloaded automatically.Recommendation.
To work with the Stimulsoft report generator correctly, we urge you to update to the latest version of our products constantly.
Installation
Now, let’s go to the installation process. You should run the downloaded file, get acquainted with our license agreement, accept it and click the Install button. After the application is installed, click the Finish button to complete the process.Authorization
To work with Stimulsoft Designer, you should have a user account, which you may create both in the application and on our website. To do this, you can log in when running the report designer and in the following subdomains:demo.stimulsoft.com
This online storage contains samples of reports and dashboards structured by categories - education, finance, healthcare, insurance, marketing, sales etc.cloud.stimulsoft.com
This cloud service is used for rapid and effective analysis and visualization of data without programming and the need for creating own applications.devs.stimulsoft.com
This is the Admin panel for users. You can view invoices issued, check subscription expiration dates, check information about users and purchased product licenses, and download license keys.Skill levels
After successful installation and authorization, you should select a skill level of the report designer. The number of properties, options, element settings will depend on the skill level you choose. There are 3 skill levels:- Professional.
It’s the most advanced level for proficient users. It contains a full functionality of options, settings, and tools. - Standard.
This skill level includes a full set of report components and dashboard elements but with a limited number of settings. - Basic.
This is the best option for those who do the first steps in report design. It contains a minimum set of settings.
Skill level selection
To set the skill level, you should go to the report or dashboard editing mode, open the account menu in the upper right corner by clicking on the account name and selecting the Account item. After that, the profile window will pop up. You will find the Skill Level option there, where you may choose the level you need. Also, you can use another way – select the level you need in the properties panel settings or select it from the context menu of this panel. More detailed information about it, you can find here.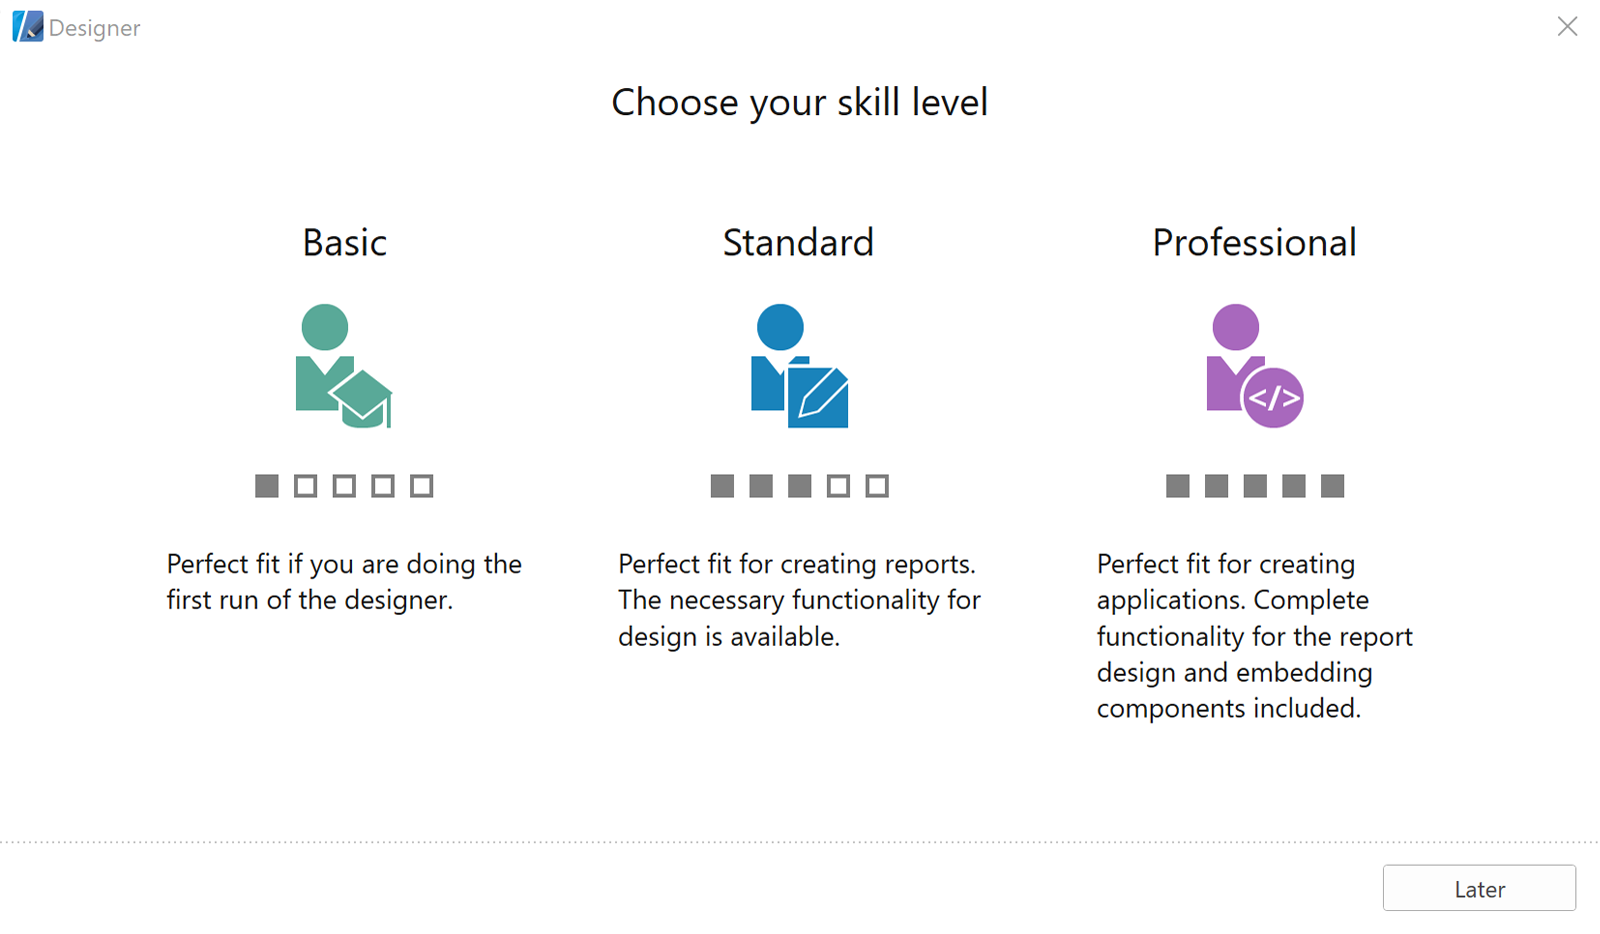
Download developer packages
We offer packages for developers – a set of libraries, scripts, and other files. Using them, developers can use reports and dashboards in their projects. Each project contains the report and data analysis engine, reports and dashboards designers, and viewers for all supported platforms such as WinForms, WPF, ASP.NET, ASP.NET MVC, .NET Core, Blazor, JavaScript, Node.js, Angular, PHP, Java, and various frameworks, built on these platforms.To download them, you should go to the Downloads page (the page where you downloaded the report designer), find the Stimulsoft Packages for Developers section. After that, a zip archive with Stimulsoft libraries and scripts, which you can use to develop your applications, will be downloaded to your computer.
Did you know that..?
Apart from Stimulsoft Designer, you can use Stimulsoft Designer.JS. The first one works only on the Windows operating system, while a JS version works on all operating systems. By the way, there are separate installation files for macOS and Linux, and you can find them by opening the Downloads page and the More apps point.In the next article, we will move on to working in the tool and give information about connecting data in the report designer. If you have any questions about downloading our tool, installing it, or choosing a skill level, please contact us or check out our documentation where you can find step-by-step instructions for each item.