Today we will tell you about the report design.
What is it for?
Some unique design of a report doesn`t exert influence over final numbers and doesn`t change their meaning for business, but:- Not infrequently, you have to prioritize correctly to emphasize really important information;
- Applying a corporate style of your company requires similar visual settings for the entire report;
- Correctly emphasized important information is absorbed simpler and faster;
- After all, report design is your style and your standards, your face in the eyes of your clients.
This has been dealt with. Next question:
How can I make a report?
You should know that in this article we will tell you about the ways of designing a report and not about how to do it. We have particular articles and lessons about it; the links to them we will indicate to you later in the text.So, you can design a report in the following ways:
- With the help of the component properties;
- With the help of report styles and their collections;
- Using conditional formatting.
Now we will consider each way in detail.
As a rule, this way is used if you need to change only the design of one component or change some parameter of the design without editing the component style.
Having followed this link you`ll find information about conditional formatting in dashboards, and here is a video selection on the topic.
When you acquire the skill of customizing design, you go to a new level in creating reports and dashboards. It's quite easier to do it with Stimulsoft than it seems.
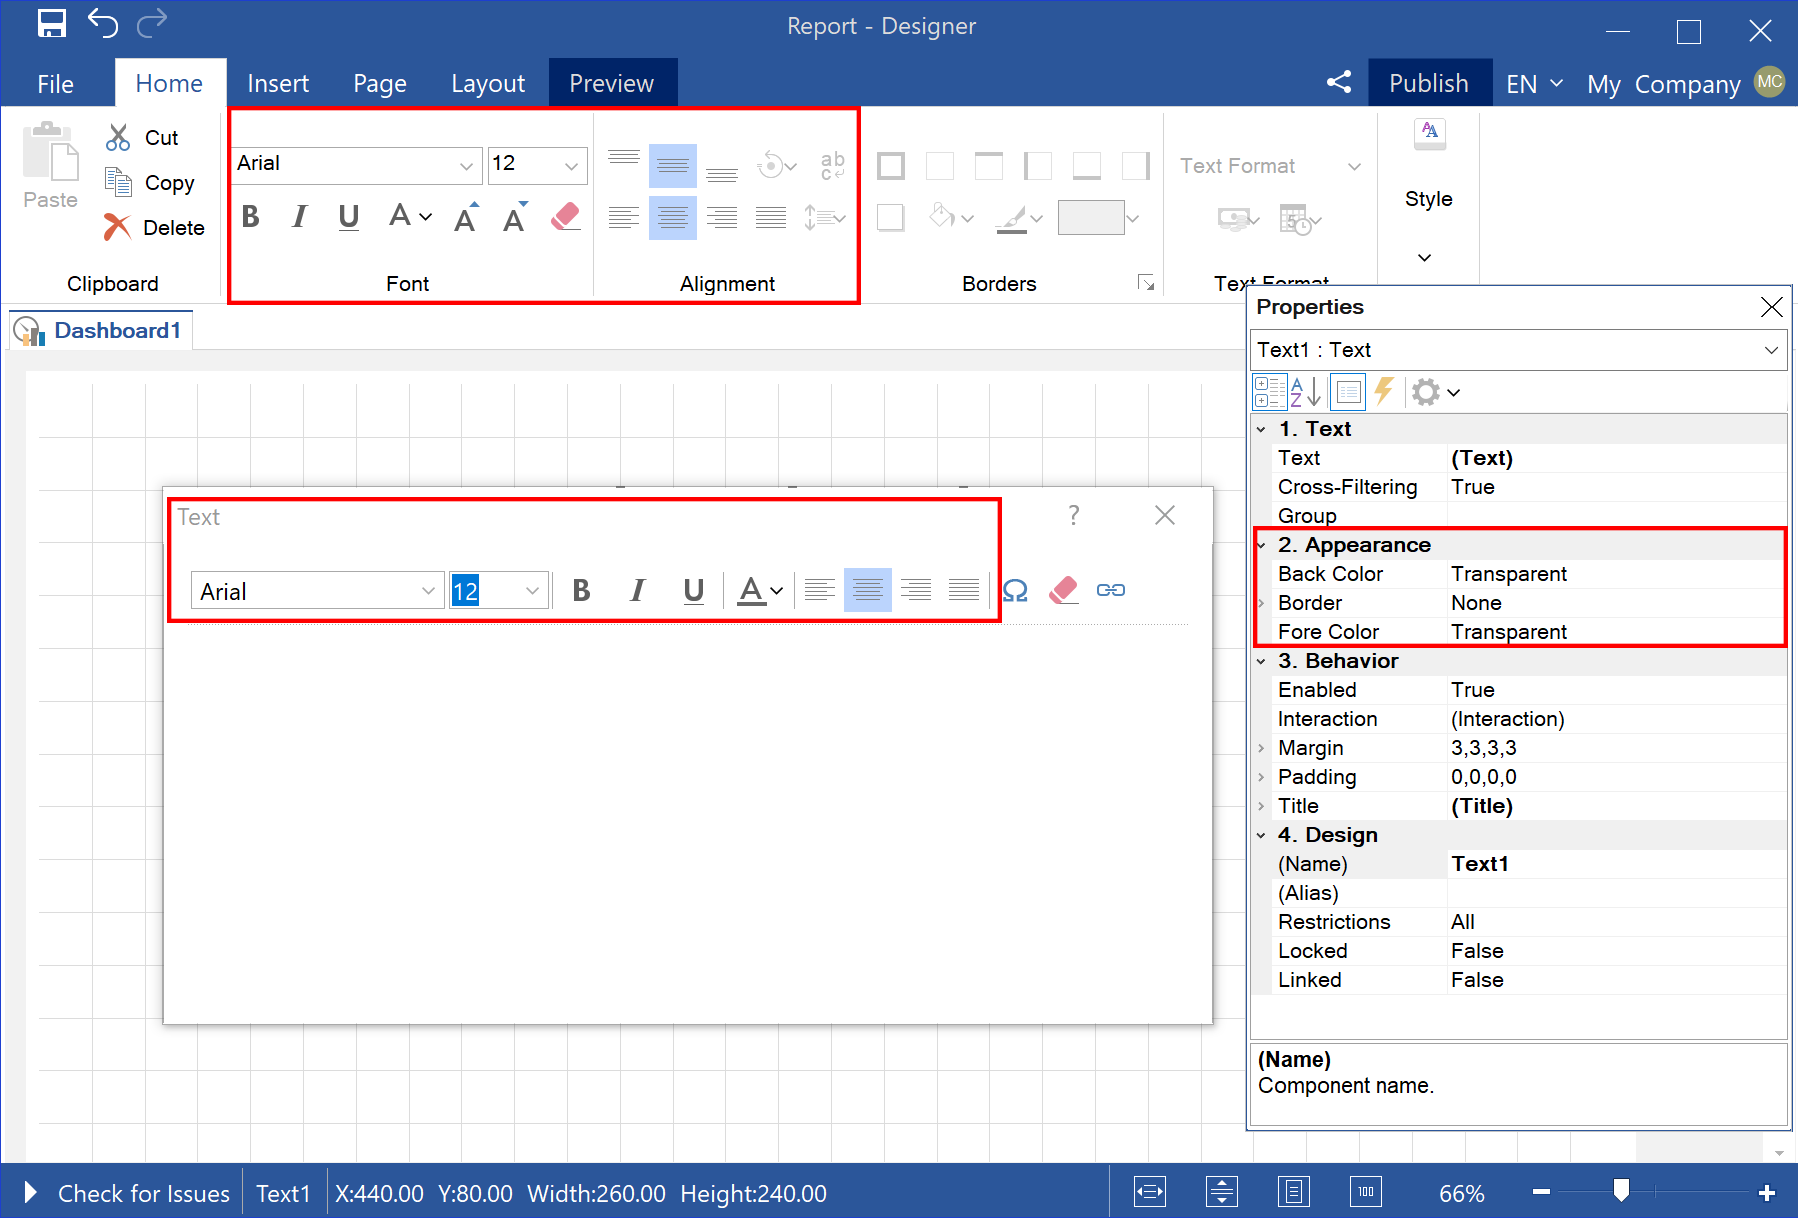
Design using of a component properties
Each report or dashboard component contains a range of design properties. It contains not just changing the color of the content or background but also borders, indents, and shadows. You may find all these properties in the property panel of a selected component. Some settings are duplicated on the Ribbon tab and in the component editor. For example, as it happens with the Dashboard text element. There are its settings in the properties panel, on the Ribbon tab, and in the editor of this element.As a rule, this way is used if you need to change only the design of one component or change some parameter of the design without editing the component style.
Design using styles
It`s an excellent way of designing lots of reports, also recommended when using corporate style. Generally, knowledge and proficiency of using styles in reports open up endless possibilities when designing them. Having created a component style once, you can use it constantly and in any other report. There is only one thing - for each component type, its own style is created, but it`s due to the settings of designing a specific component type are individual. For reports, by the way, styles can be combined into collections, and then a collection can be applied to a report automatically. Essentially, you can create a report with various visual designs. You can save all the styles and collections you create to a separate file, which you can use in other reports. You can find more detailed information about styles in dashboards here, about styles here, and here are various videos about work with styles in a report.Design using conditional formatting
An interactive way to change design settings. Depending on the execution of a condition, you can change the design settings for various components of a report and elements of a dashboard. In addition, a condition can enable some action of a user (it means the choice of a parameter value in the viewer) or not enable. Conditional formatting can be used as a tool of analysis too. For example, when achieving boundary values, the design may change. By the way, you can even change style when a condition is met in a report on conditional formatting. Some lines above, we have written how it is important to have the skill of working with styles, but if you use conditional formatting in addition to this, you`re just a pro in setting the design of reports and dashboards.Having followed this link you`ll find information about conditional formatting in dashboards, and here is a video selection on the topic.
When you acquire the skill of customizing design, you go to a new level in creating reports and dashboards. It's quite easier to do it with Stimulsoft than it seems.