


Stimulsoft Reports.JAVA
Reporting tool for Java
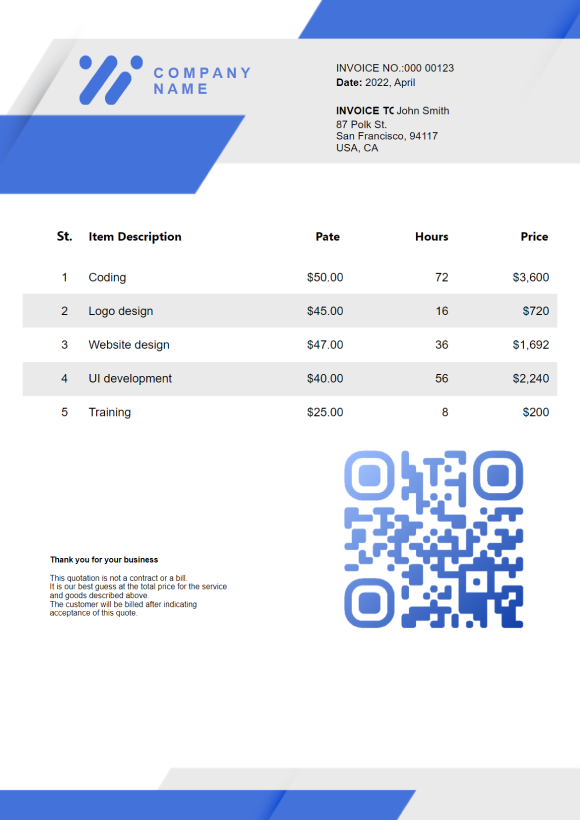
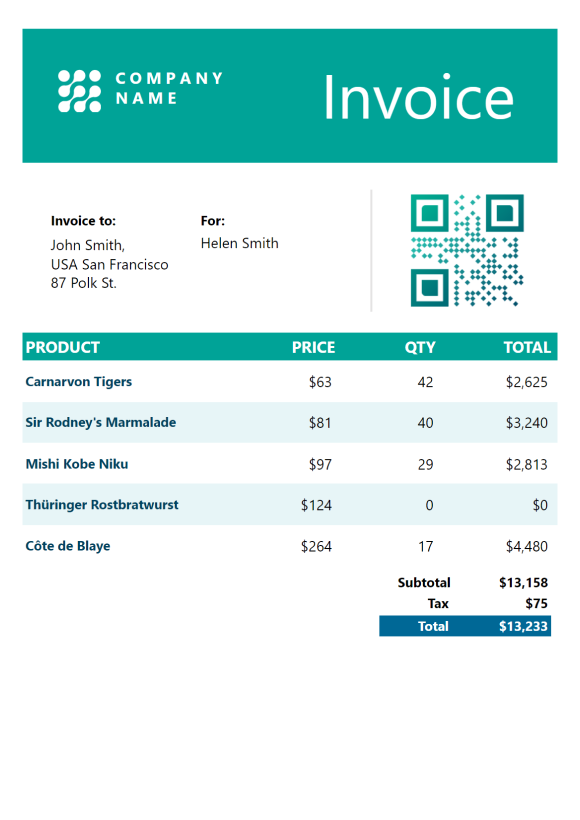
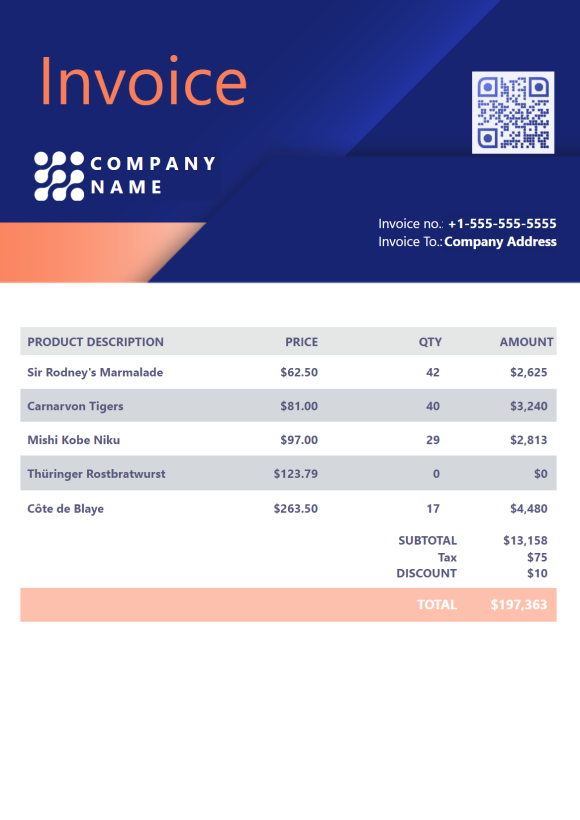
Stimulsoft Reports.JAVA is a reporting tool intended for interaction and work of business reports in your Java application. It contains Java and HTML5 components that allow you to use created programs on different platforms, different operating systems, and different hardware. Due to this, our report builder for Java is available literally everywhere meanwhile remaining a highly functional and user-friendly reporting tool.How the reporting tool works for Java
Due to the Stimulsoft library, you can easily and quickly add reports to any Java-based application. Engine of processing that is available in the report generator allows you not only to launch our product on any server where Java is used but also simplifies distributing and installing the product. The work of the report generator and components of data visualization is built taking into account peculiarities of using the functionality both in client-server Web projects and in desktop versions of the projects written using a popular library for developing graphical interfaces SWT (Standard Widget Toolkit). Also, integration into JavaServer Pages and JavaServer Faces is available.
Report designer
A full-featured desktop designer that works on many platforms without any problems with compatibility is available for Stimulsoft Reports.JAVA. In addition to desktop version, our report generator for Java contains a component for running and viewing reports in a browser (Web component) and report viewer for integration into applications (SWT component).Web component
It's a tool for a full circle of work with reports in a browser. You can run, save and load reports from a file system or a data base, create and export them in the server.
SWT component
A full-featured report viewer for integration into Java applications. The component supports all features of the viewer: from customization of control components to visual work with filters and sorting.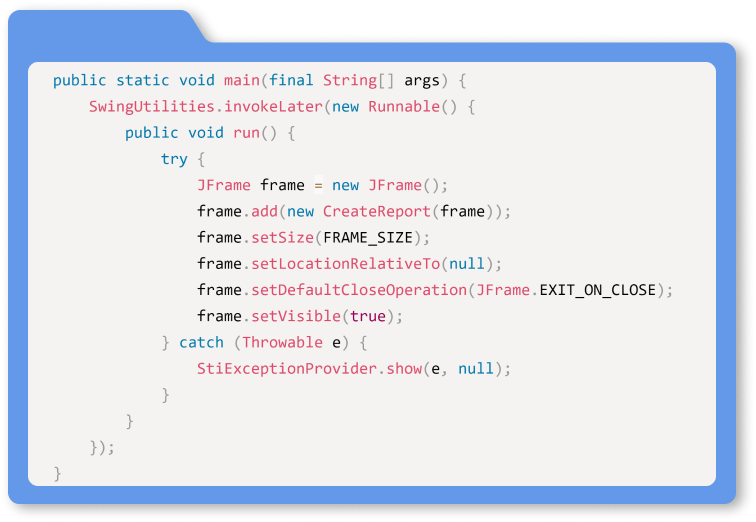
Step-by-step report creation

Preparing data
To create reports, you can connect data from many sources using both interface of the designer and a programming code. In addition, data transformation is available that allows you to customize, sort, filter and much more.
Report design
To create a report, charts, maps, bar codes, images, watermarks, shapes, sparklines, mathematical formulas, as well as nested reports, tables of contents, and many other components are available for report creation.
Publish, view, export
A created report can be easily published to a project using a special tool – Publish Wizard. Also, you can export a report in more than 30 formats and share it on social networks or via email.Interactive reports
Stimulsoft Reports.JAVA report engine allows you to achieve maximum flexibility when working with ready-made reports: apply sorting, grouping, data detailing, work with report variables and query parameters to databases. All this functionality is available both from a Java code when rendering and exporting reports on the server side and directly in the interactive viewer window. The support of report globalization and UI components will allow you to eliminate the language barrier and use your solutions for foreign partners and clients.
Data for reports
Our reporting tool supports many ways to connect data to a report using both the report designer functionality and code. We offer a vast list of supported data servers – MS SQL, Oracle, MySQL, PostgreSQL, etc. You can use the Java Database Connectivity (JDBC) data adapter and get data from XML and JSON files.Integration

Our reporting tool is easily integrated into almost any Java application, including JavaServer Pages and JavaServer Faces. You need just a few lines of code to run the report. The application has a flexible and intuitive setup process. We created a special functionality for quick and simple report integration to a project – Publish Wizard, that is available in the standalone designer and online.
All you need for integration is to install a package from the maven repository or download the package from our website to your computer and add the necessary libraries to your project. Our report builder supports Java™ SE 1.8 and above.
Compatibility

Stimulsoft Reports.JAVA report builder is a part of the unified Stimulsoft platform, and the reports created in other products will work in Stimulsoft Java and vice versa. You can create a report template in the desktop version of the report designer and continue to edit it in the cloud using the online version. We have tried to ensure that reports and dashboards are compatible with each technology.

Stimulsoft Ultimate
Stimulsoft Reports.JAVA is part of Stimulsoft Ultimate, a comprehensive All-in-One set of products designed for working with data on all modern platforms such as .NET, ASP.NET, JavaScript, Java, PHP, Blazor, Angular, WPF, WinForms, Avalonia UI, Python, and others. With our components, you can create, print, export complex reports, analyze data using clear and colorful dashboards, and collect data from users through interactive forms.What's next?
We have prepared hundreds of reports and dashboards templates grouped by spheres of use. You can immediately use them by connecting your data or change according to your requirements. Our lessons and technical documentation will help make your work effective! Moreover, you can request the training courses from our technical specialists, subscribe to our YouTube channel to always get new videos, and receive all your answers in our online documentation.
Training courses
Are you faced with difficulties when creating reports and dashboards? This is not a problem!
Video lessons
We have prepared many video materials for the designing reports and dashboards. All tutorials are grouped by specific topics and regularly updated and supplemented.
Documentation
Our online user guides describe both the general functionality of the product and provide advice and suggestions for the report design and hints of setting components for reporting.
